> ## Documentation Index
> Fetch the complete documentation index at: https://docs.arcbeam.ai/llms.txt
> Use this file to discover all available pages before exploring further.
# Dataset Analytics
> Understand usage patterns and quality across your entire datasets
While document-level analytics show individual pieces of content, dataset analytics reveal patterns across your entire knowledge base. This helps you assess overall quality and identify systemic issues.
## What Is a Dataset?
A dataset is a collection of related documents, typically grouped by source. Datasets are created automatically when you sync a data source, grouped by the `source` field in your vector database.
All docs from your product guide
Knowledge base articles
Internal technical docs
API documentation
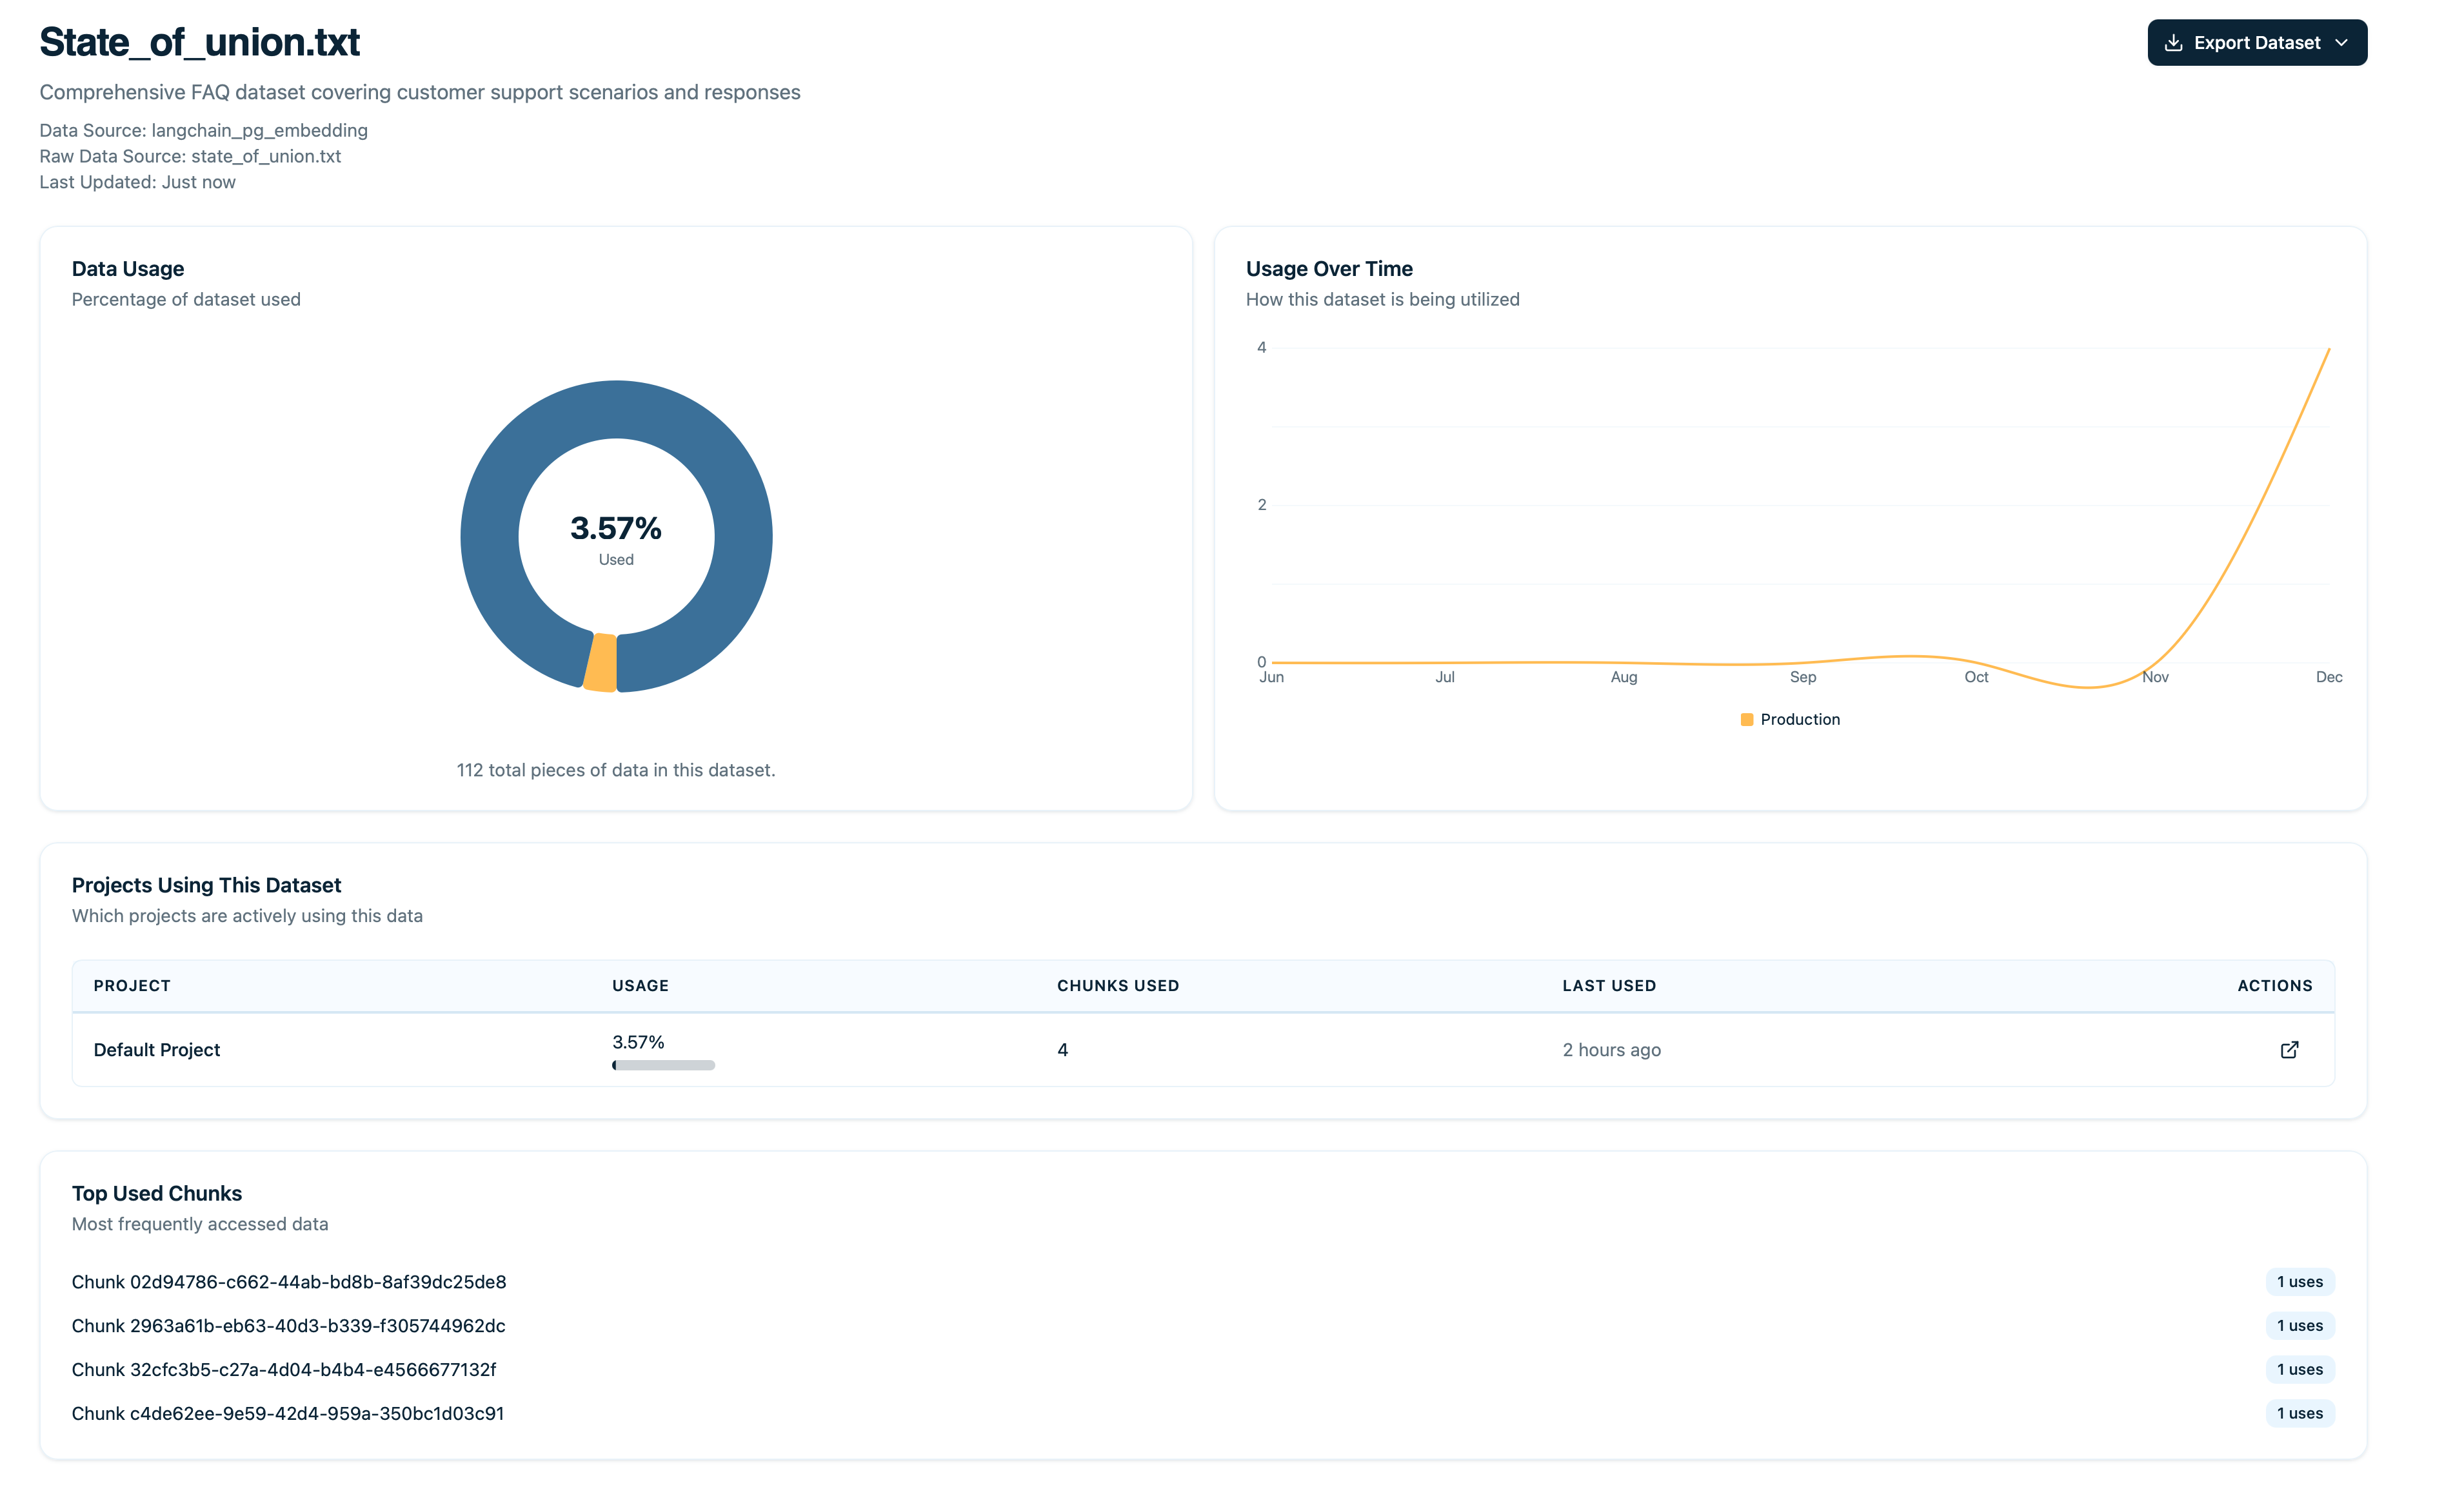
## Viewing Dataset Analytics
Go to **Data → Datasets** in the navigation menu
You'll see a list of all datasets with their key metrics at a glance
Click on any dataset to see comprehensive analytics and insights
 ## Dataset Overview Metrics
**How many documents** are in this dataset.
**How many times** any document in this dataset was retrieved.
| Dataset Size | Document Count | Meaning |
| ------------ | -------------- | ------------------------------ |
| Large | 1000+ | Comprehensive coverage |
| Medium | 100-1000 | Moderate coverage |
| Small | \< 100 | Focused or incomplete coverage |
| Activity Level | Meaning |
| -------------- | ----------------------------------- |
| High | Core dataset, frequently referenced |
| Medium | Regularly used |
| Low | Rarely needed |
### Usage Rate
**Percentage of documents** that have been retrieved at least once.
| Usage Rate | Meaning |
| ---------- | ------------------------------------- |
| > 50% | Excellent - Most documents are useful |
| 30-50% | Good - Majority of docs are relevant |
| 10-30% | Fair - Many unused documents |
| \< 10% | Poor - Dataset mostly unused |
**Low usage rate?** Consider these actions:
* Many documents are irrelevant → Prune the dataset
* Embeddings are poor → Re-embed with better model
* Documents aren't discoverable → Improve metadata/chunking
### Average Relevance Coming Soon
**Mean relevance score** across all retrievals in this dataset.
| Score | Quality |
| --------- | ----------------------------------- |
| > 0.75 | Excellent - Strong semantic matches |
| 0.60-0.75 | Good - Mostly relevant |
| 0.45-0.60 | Fair - Some weak matches |
| \< 0.45 | Poor - Retrieval quality issues |
**Low average relevance?** Indicates:
* Poor embeddings
* Documents not well-written for retrieval
* Retrieval parameters too loose
## Document Distribution
See how retrievals are distributed across documents to understand which content is most valuable and which might need attention.
### Top Documents
The most-retrieved documents in this dataset.
| Information Shown | Description |
| ------------------------------ | --------------------------------------- |
| Document name | Title of the document |
| Retrieval count | Number of times retrieved |
| Percentage of total retrievals | Share of all retrievals in this dataset |
### Unused Documents
Documents with zero retrievals that may need attention.
| Information Shown | Description |
| ----------------- | ---------------------------------------- |
| Document name | Title of the document |
| Last updated | When it was last modified |
| Reason | Why it might be unused (if determinable) |
Click on any unused document to read its content, check if it should be deleted or improved, and verify embeddings are working.
### Retrieval Distribution Graph Coming Soon
Histogram showing how many documents fall into each retrieval count bucket.
| Bucket | Retrieval Count | Example Document Count |
| -------- | ----------------- | ---------------------- |
| Bucket 0 | 0 retrievals | 45 documents |
| Bucket 1 | 1-10 retrievals | 30 documents |
| Bucket 2 | 11-50 retrievals | 15 documents |
| Bucket 3 | 51-100 retrievals | 8 documents |
| Bucket 4 | 100+ retrievals | 2 documents |
Helps visualize how many documents are truly unused and if usage is concentrated or spread evenly.
**Highly concentrated retrievals?** If top 10 documents account for >80% of retrievals:
| Aspect | Interpretation |
| ------ | ----------------------------------- |
| Good | You know which docs are critical |
| Bad | Rest of dataset might be irrelevant |
## Usage Trends Over Time
Graph showing retrieval activity for this dataset over time:
## Dataset Overview Metrics
**How many documents** are in this dataset.
**How many times** any document in this dataset was retrieved.
| Dataset Size | Document Count | Meaning |
| ------------ | -------------- | ------------------------------ |
| Large | 1000+ | Comprehensive coverage |
| Medium | 100-1000 | Moderate coverage |
| Small | \< 100 | Focused or incomplete coverage |
| Activity Level | Meaning |
| -------------- | ----------------------------------- |
| High | Core dataset, frequently referenced |
| Medium | Regularly used |
| Low | Rarely needed |
### Usage Rate
**Percentage of documents** that have been retrieved at least once.
| Usage Rate | Meaning |
| ---------- | ------------------------------------- |
| > 50% | Excellent - Most documents are useful |
| 30-50% | Good - Majority of docs are relevant |
| 10-30% | Fair - Many unused documents |
| \< 10% | Poor - Dataset mostly unused |
**Low usage rate?** Consider these actions:
* Many documents are irrelevant → Prune the dataset
* Embeddings are poor → Re-embed with better model
* Documents aren't discoverable → Improve metadata/chunking
### Average Relevance Coming Soon
**Mean relevance score** across all retrievals in this dataset.
| Score | Quality |
| --------- | ----------------------------------- |
| > 0.75 | Excellent - Strong semantic matches |
| 0.60-0.75 | Good - Mostly relevant |
| 0.45-0.60 | Fair - Some weak matches |
| \< 0.45 | Poor - Retrieval quality issues |
**Low average relevance?** Indicates:
* Poor embeddings
* Documents not well-written for retrieval
* Retrieval parameters too loose
## Document Distribution
See how retrievals are distributed across documents to understand which content is most valuable and which might need attention.
### Top Documents
The most-retrieved documents in this dataset.
| Information Shown | Description |
| ------------------------------ | --------------------------------------- |
| Document name | Title of the document |
| Retrieval count | Number of times retrieved |
| Percentage of total retrievals | Share of all retrievals in this dataset |
### Unused Documents
Documents with zero retrievals that may need attention.
| Information Shown | Description |
| ----------------- | ---------------------------------------- |
| Document name | Title of the document |
| Last updated | When it was last modified |
| Reason | Why it might be unused (if determinable) |
Click on any unused document to read its content, check if it should be deleted or improved, and verify embeddings are working.
### Retrieval Distribution Graph Coming Soon
Histogram showing how many documents fall into each retrieval count bucket.
| Bucket | Retrieval Count | Example Document Count |
| -------- | ----------------- | ---------------------- |
| Bucket 0 | 0 retrievals | 45 documents |
| Bucket 1 | 1-10 retrievals | 30 documents |
| Bucket 2 | 11-50 retrievals | 15 documents |
| Bucket 3 | 51-100 retrievals | 8 documents |
| Bucket 4 | 100+ retrievals | 2 documents |
Helps visualize how many documents are truly unused and if usage is concentrated or spread evenly.
**Highly concentrated retrievals?** If top 10 documents account for >80% of retrievals:
| Aspect | Interpretation |
| ------ | ----------------------------------- |
| Good | You know which docs are critical |
| Bad | Rest of dataset might be irrelevant |
## Usage Trends Over Time
Graph showing retrieval activity for this dataset over time:
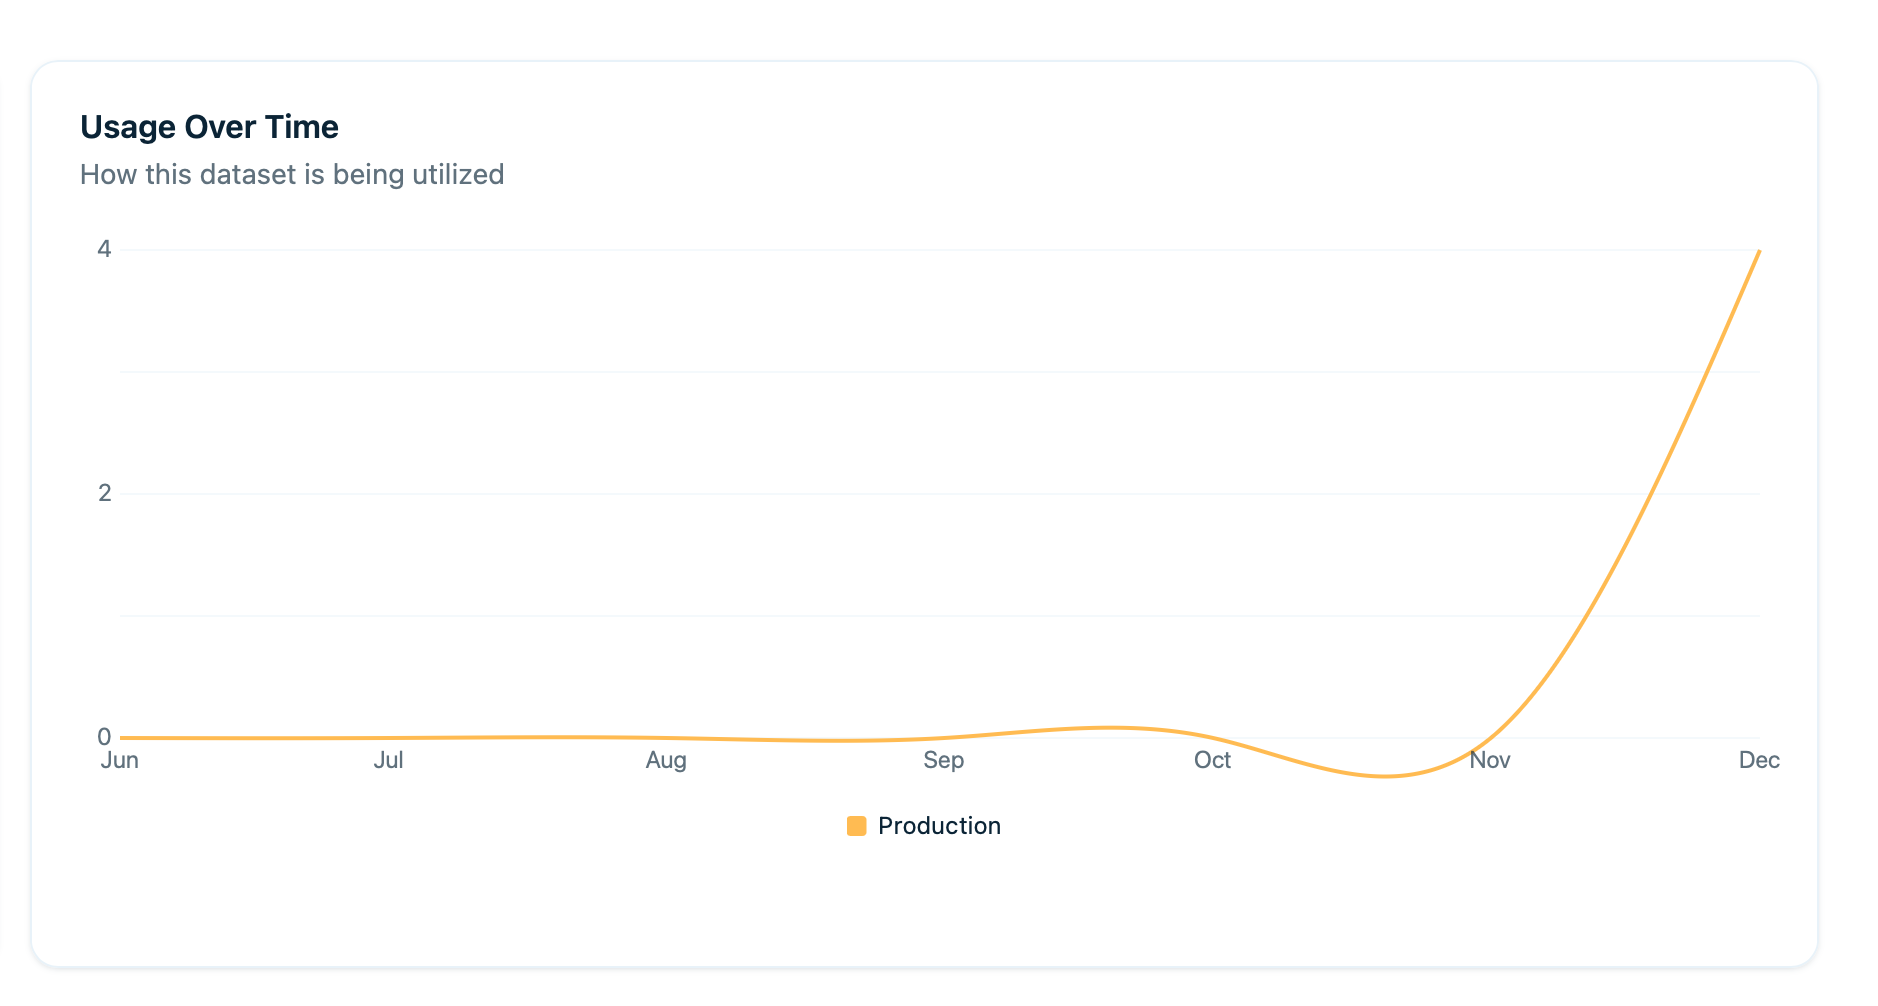 | Trend Type | What It Means |
| ----------------- | ----------------------------------------------- |
| Growth Trends | Increasing usage as more queries come in |
| Declining Trends | Dataset becoming less relevant over time |
| Usage Spikes | Sudden interest in this topic or content area |
| Seasonal Patterns | Certain times of year show predictable patterns |
**Example**: Tax documentation dataset spikes in March-April during tax season.
## Quality Indicators Coming Soon
### User Feedback Correlation
How users rate traces that used documents from this dataset:
| Metric | Description |
| ----------------- | ---------------------------------------------- |
| Thumbs up count | Positive feedback on traces using this dataset |
| Thumbs down count | Negative feedback |
| Satisfaction rate | Percentage positive |
### Coverage Score
**What percentage of queries** in your traces find relevant documents (relevance > 0.7) from this dataset.
| Coverage Level | Percentage | Meaning |
| -------------- | ---------- | -------------------------------------------- |
| High | >70% | Dataset answers most questions in its domain |
| Medium | 40-70% | Some gaps exist |
| Low | \<40% | Significant gaps, many queries unanswered |
**Low satisfaction?** This dataset may:
* Contain outdated information
* Have poor quality documents
* Not cover topics users expect
**Example**: Support articles dataset has 45% coverage → 55% of support queries find no good documents.
## Comparing Datasets
View multiple datasets side-by-side to make informed decisions about where to focus your efforts.
| Comparison Metric | What It Reveals |
| ----------------- | ------------------------------------------------------ |
| Usage Rates | Which datasets are most utilized by your AI system |
| Average Relevance | Which have best quality and strongest semantic matches |
| User Satisfaction | Which lead to good responses and positive feedback |
| Growth Trends | Which are growing or declining in importance |
**Use comparison view to**:
* Prioritize which datasets to improve
* Allocate resources (focus on high-usage, low-quality datasets)
* Identify which datasets can be archived or removed
## Use Cases
### Identify Low-Quality Datasets
**Goal**: Find datasets that need improvement.
Sort datasets by **Average Relevance** (low to high) to surface the lowest quality datasets
Review the bottom 3 datasets and examine sample documents from each
Decide what to do based on the root cause:
* Documents are poorly written → Rewrite
* Embeddings are bad → Re-embed
* Dataset is irrelevant → Archive or remove
**Result**: Higher overall retrieval quality across your system.
### Prioritize Dataset Updates
**Goal**: Focus updates on high-impact datasets.
Sort by **Total Retrievals** (high to low) to identify your most-used datasets
Review the "Last Updated" date for top datasets
Focus your efforts on updating old, high-traffic datasets first. Deprioritize low-traffic datasets.
**Result**: Maximum impact from limited resources.
### Find Coverage Gaps
**Goal**: Discover topics where you need more content.
Look at datasets with **low coverage scores** to find areas with content gaps
Check traces that found no relevant documents and group by topic/query type
Identify missing content areas and add new documents to fill those gaps
**Result**: Better coverage, fewer unanswered queries.
### Measure Dataset Improvement
**Goal**: Track progress after improving a dataset.
Document current metrics: usage rate, average relevance, and user satisfaction
Update documents in the dataset and re-sync your data source
Wait 2-4 weeks for enough usage data to accumulate
Check metrics again and compare before/after to measure improvement
**Result**: Data-driven proof of improvement.
### Retire Unused Datasets
**Goal**: Clean up datasets no one uses.
Filter to datasets with **\<5% usage rate** over 90 days
Review what's in these datasets to understand why they're unused
Decide if truly irrelevant or just poorly embedded
Archive or delete unused datasets to keep your vector database lean
**Result**: Faster retrievals, reduced storage costs.
## Dataset Health Score
Arcbeam calculates an overall health score for each dataset based on multiple factors:
Higher is better - more documents being retrieved
Higher is better - stronger semantic matches
Higher is better - positive user feedback
Higher is better - fewer gaps in content
More recent is better - fresh content
| Score | Health |
| ------ | ------------------------------------------------- |
| 80-100 | Excellent - Well-maintained, high-quality dataset |
| 60-79 | Good - Solid dataset, minor improvements possible |
| 40-59 | Fair - Needs attention, several issues |
| \< 40 | Poor - Major issues, requires immediate work |
**Use health score to**:
* Quickly assess all datasets at a glance
* Prioritize which datasets need work
* Track improvements over time
## Setting Goals
Set improvement targets for your datasets to drive measurable progress.
### Example Goals
**Current State**:
* 42% usage rate
* 0.68 avg relevance
**Target**:
* 60% usage rate
* 0.75 avg relevance
**Action Plan**:
* Update top 20 docs
* Remove 15 unused docs
* Re-embed all documents
**Current State**:
* 35% user satisfaction
**Target**:
* 70% user satisfaction
**Action Plan**:
* Rewrite top 10 most-used articles
* Add 20 new articles for gaps
## Best Practices
### Review Dataset Health Monthly
Set a recurring task to monitor and improve your datasets.
| Task | Description |
| ---------------------- | ------------------------------------- |
| Check health scores | Review health scores for all datasets |
| Investigate drops | Look into any scores that decreased |
| Celebrate improvements | Acknowledge progress and wins |
### Focus on High-Usage Datasets First
Limited time? Prioritize based on this decision matrix:
| Usage Level | Quality Level | Action Priority |
| ----------- | ------------- | -------------------------------- |
| High | Low | Fix these first - maximum impact |
| High | High | Maintain current quality |
| Low | Low | Archive or improve later |
| Low | High | Monitor for future relevance |
### Track Metrics Over Time
Create a spreadsheet to monitor trends and patterns.
| What to Track | Why It Matters |
| ------------------------------------------- | -------------------------------------- |
| Record key metrics monthly | Establish baseline and track progress |
| Track trends (improving, stable, declining) | Identify which datasets need attention |
| Identify seasonal patterns | Plan for predictable usage spikes |
### Correlate with Business Goals
Align dataset priorities with business needs for maximum value.
| Business Situation | Dataset Focus |
| ----------------------- | ---------------------------------------- |
| Launching new product | Ensure product docs dataset is excellent |
| Customer support issues | Focus on support articles dataset |
| Onboarding problems | Improve getting-started dataset |
| Feature adoption low | Enhance feature documentation dataset |
### Re-embed Periodically
Every 6-12 months, refresh your embeddings to maintain quality.
| Action | Benefit |
| ---------------------------------------------- | ------------------------------------------------ |
| Re-embed datasets with latest embedding models | Newer models often improve retrieval quality |
| Track if average relevance increases | Measure ROI of re-embedding effort |
| Compare before/after metrics | Validate improvement and inform future decisions |
## Next Steps
Drill down into individual documents
Track which source files are most valuable
Keep datasets up to date
Use dataset metrics to improve RAG
| Trend Type | What It Means |
| ----------------- | ----------------------------------------------- |
| Growth Trends | Increasing usage as more queries come in |
| Declining Trends | Dataset becoming less relevant over time |
| Usage Spikes | Sudden interest in this topic or content area |
| Seasonal Patterns | Certain times of year show predictable patterns |
**Example**: Tax documentation dataset spikes in March-April during tax season.
## Quality Indicators Coming Soon
### User Feedback Correlation
How users rate traces that used documents from this dataset:
| Metric | Description |
| ----------------- | ---------------------------------------------- |
| Thumbs up count | Positive feedback on traces using this dataset |
| Thumbs down count | Negative feedback |
| Satisfaction rate | Percentage positive |
### Coverage Score
**What percentage of queries** in your traces find relevant documents (relevance > 0.7) from this dataset.
| Coverage Level | Percentage | Meaning |
| -------------- | ---------- | -------------------------------------------- |
| High | >70% | Dataset answers most questions in its domain |
| Medium | 40-70% | Some gaps exist |
| Low | \<40% | Significant gaps, many queries unanswered |
**Low satisfaction?** This dataset may:
* Contain outdated information
* Have poor quality documents
* Not cover topics users expect
**Example**: Support articles dataset has 45% coverage → 55% of support queries find no good documents.
## Comparing Datasets
View multiple datasets side-by-side to make informed decisions about where to focus your efforts.
| Comparison Metric | What It Reveals |
| ----------------- | ------------------------------------------------------ |
| Usage Rates | Which datasets are most utilized by your AI system |
| Average Relevance | Which have best quality and strongest semantic matches |
| User Satisfaction | Which lead to good responses and positive feedback |
| Growth Trends | Which are growing or declining in importance |
**Use comparison view to**:
* Prioritize which datasets to improve
* Allocate resources (focus on high-usage, low-quality datasets)
* Identify which datasets can be archived or removed
## Use Cases
### Identify Low-Quality Datasets
**Goal**: Find datasets that need improvement.
Sort datasets by **Average Relevance** (low to high) to surface the lowest quality datasets
Review the bottom 3 datasets and examine sample documents from each
Decide what to do based on the root cause:
* Documents are poorly written → Rewrite
* Embeddings are bad → Re-embed
* Dataset is irrelevant → Archive or remove
**Result**: Higher overall retrieval quality across your system.
### Prioritize Dataset Updates
**Goal**: Focus updates on high-impact datasets.
Sort by **Total Retrievals** (high to low) to identify your most-used datasets
Review the "Last Updated" date for top datasets
Focus your efforts on updating old, high-traffic datasets first. Deprioritize low-traffic datasets.
**Result**: Maximum impact from limited resources.
### Find Coverage Gaps
**Goal**: Discover topics where you need more content.
Look at datasets with **low coverage scores** to find areas with content gaps
Check traces that found no relevant documents and group by topic/query type
Identify missing content areas and add new documents to fill those gaps
**Result**: Better coverage, fewer unanswered queries.
### Measure Dataset Improvement
**Goal**: Track progress after improving a dataset.
Document current metrics: usage rate, average relevance, and user satisfaction
Update documents in the dataset and re-sync your data source
Wait 2-4 weeks for enough usage data to accumulate
Check metrics again and compare before/after to measure improvement
**Result**: Data-driven proof of improvement.
### Retire Unused Datasets
**Goal**: Clean up datasets no one uses.
Filter to datasets with **\<5% usage rate** over 90 days
Review what's in these datasets to understand why they're unused
Decide if truly irrelevant or just poorly embedded
Archive or delete unused datasets to keep your vector database lean
**Result**: Faster retrievals, reduced storage costs.
## Dataset Health Score
Arcbeam calculates an overall health score for each dataset based on multiple factors:
Higher is better - more documents being retrieved
Higher is better - stronger semantic matches
Higher is better - positive user feedback
Higher is better - fewer gaps in content
More recent is better - fresh content
| Score | Health |
| ------ | ------------------------------------------------- |
| 80-100 | Excellent - Well-maintained, high-quality dataset |
| 60-79 | Good - Solid dataset, minor improvements possible |
| 40-59 | Fair - Needs attention, several issues |
| \< 40 | Poor - Major issues, requires immediate work |
**Use health score to**:
* Quickly assess all datasets at a glance
* Prioritize which datasets need work
* Track improvements over time
## Setting Goals
Set improvement targets for your datasets to drive measurable progress.
### Example Goals
**Current State**:
* 42% usage rate
* 0.68 avg relevance
**Target**:
* 60% usage rate
* 0.75 avg relevance
**Action Plan**:
* Update top 20 docs
* Remove 15 unused docs
* Re-embed all documents
**Current State**:
* 35% user satisfaction
**Target**:
* 70% user satisfaction
**Action Plan**:
* Rewrite top 10 most-used articles
* Add 20 new articles for gaps
## Best Practices
### Review Dataset Health Monthly
Set a recurring task to monitor and improve your datasets.
| Task | Description |
| ---------------------- | ------------------------------------- |
| Check health scores | Review health scores for all datasets |
| Investigate drops | Look into any scores that decreased |
| Celebrate improvements | Acknowledge progress and wins |
### Focus on High-Usage Datasets First
Limited time? Prioritize based on this decision matrix:
| Usage Level | Quality Level | Action Priority |
| ----------- | ------------- | -------------------------------- |
| High | Low | Fix these first - maximum impact |
| High | High | Maintain current quality |
| Low | Low | Archive or improve later |
| Low | High | Monitor for future relevance |
### Track Metrics Over Time
Create a spreadsheet to monitor trends and patterns.
| What to Track | Why It Matters |
| ------------------------------------------- | -------------------------------------- |
| Record key metrics monthly | Establish baseline and track progress |
| Track trends (improving, stable, declining) | Identify which datasets need attention |
| Identify seasonal patterns | Plan for predictable usage spikes |
### Correlate with Business Goals
Align dataset priorities with business needs for maximum value.
| Business Situation | Dataset Focus |
| ----------------------- | ---------------------------------------- |
| Launching new product | Ensure product docs dataset is excellent |
| Customer support issues | Focus on support articles dataset |
| Onboarding problems | Improve getting-started dataset |
| Feature adoption low | Enhance feature documentation dataset |
### Re-embed Periodically
Every 6-12 months, refresh your embeddings to maintain quality.
| Action | Benefit |
| ---------------------------------------------- | ------------------------------------------------ |
| Re-embed datasets with latest embedding models | Newer models often improve retrieval quality |
| Track if average relevance increases | Measure ROI of re-embedding effort |
| Compare before/after metrics | Validate improvement and inform future decisions |
## Next Steps
Drill down into individual documents
Track which source files are most valuable
Keep datasets up to date
Use dataset metrics to improve RAG