> ## Documentation Index
> Fetch the complete documentation index at: https://docs.arcbeam.ai/llms.txt
> Use this file to discover all available pages before exploring further.
# Find Problematic Traces
> Navigate, filter, and explore traces to identify issues
When you click on a trace, you see the full details of that LLM interaction—every step, every token, every cost, and every retrieved document.
## Overview Section
At the top of the trace details page, you'll see summary information:
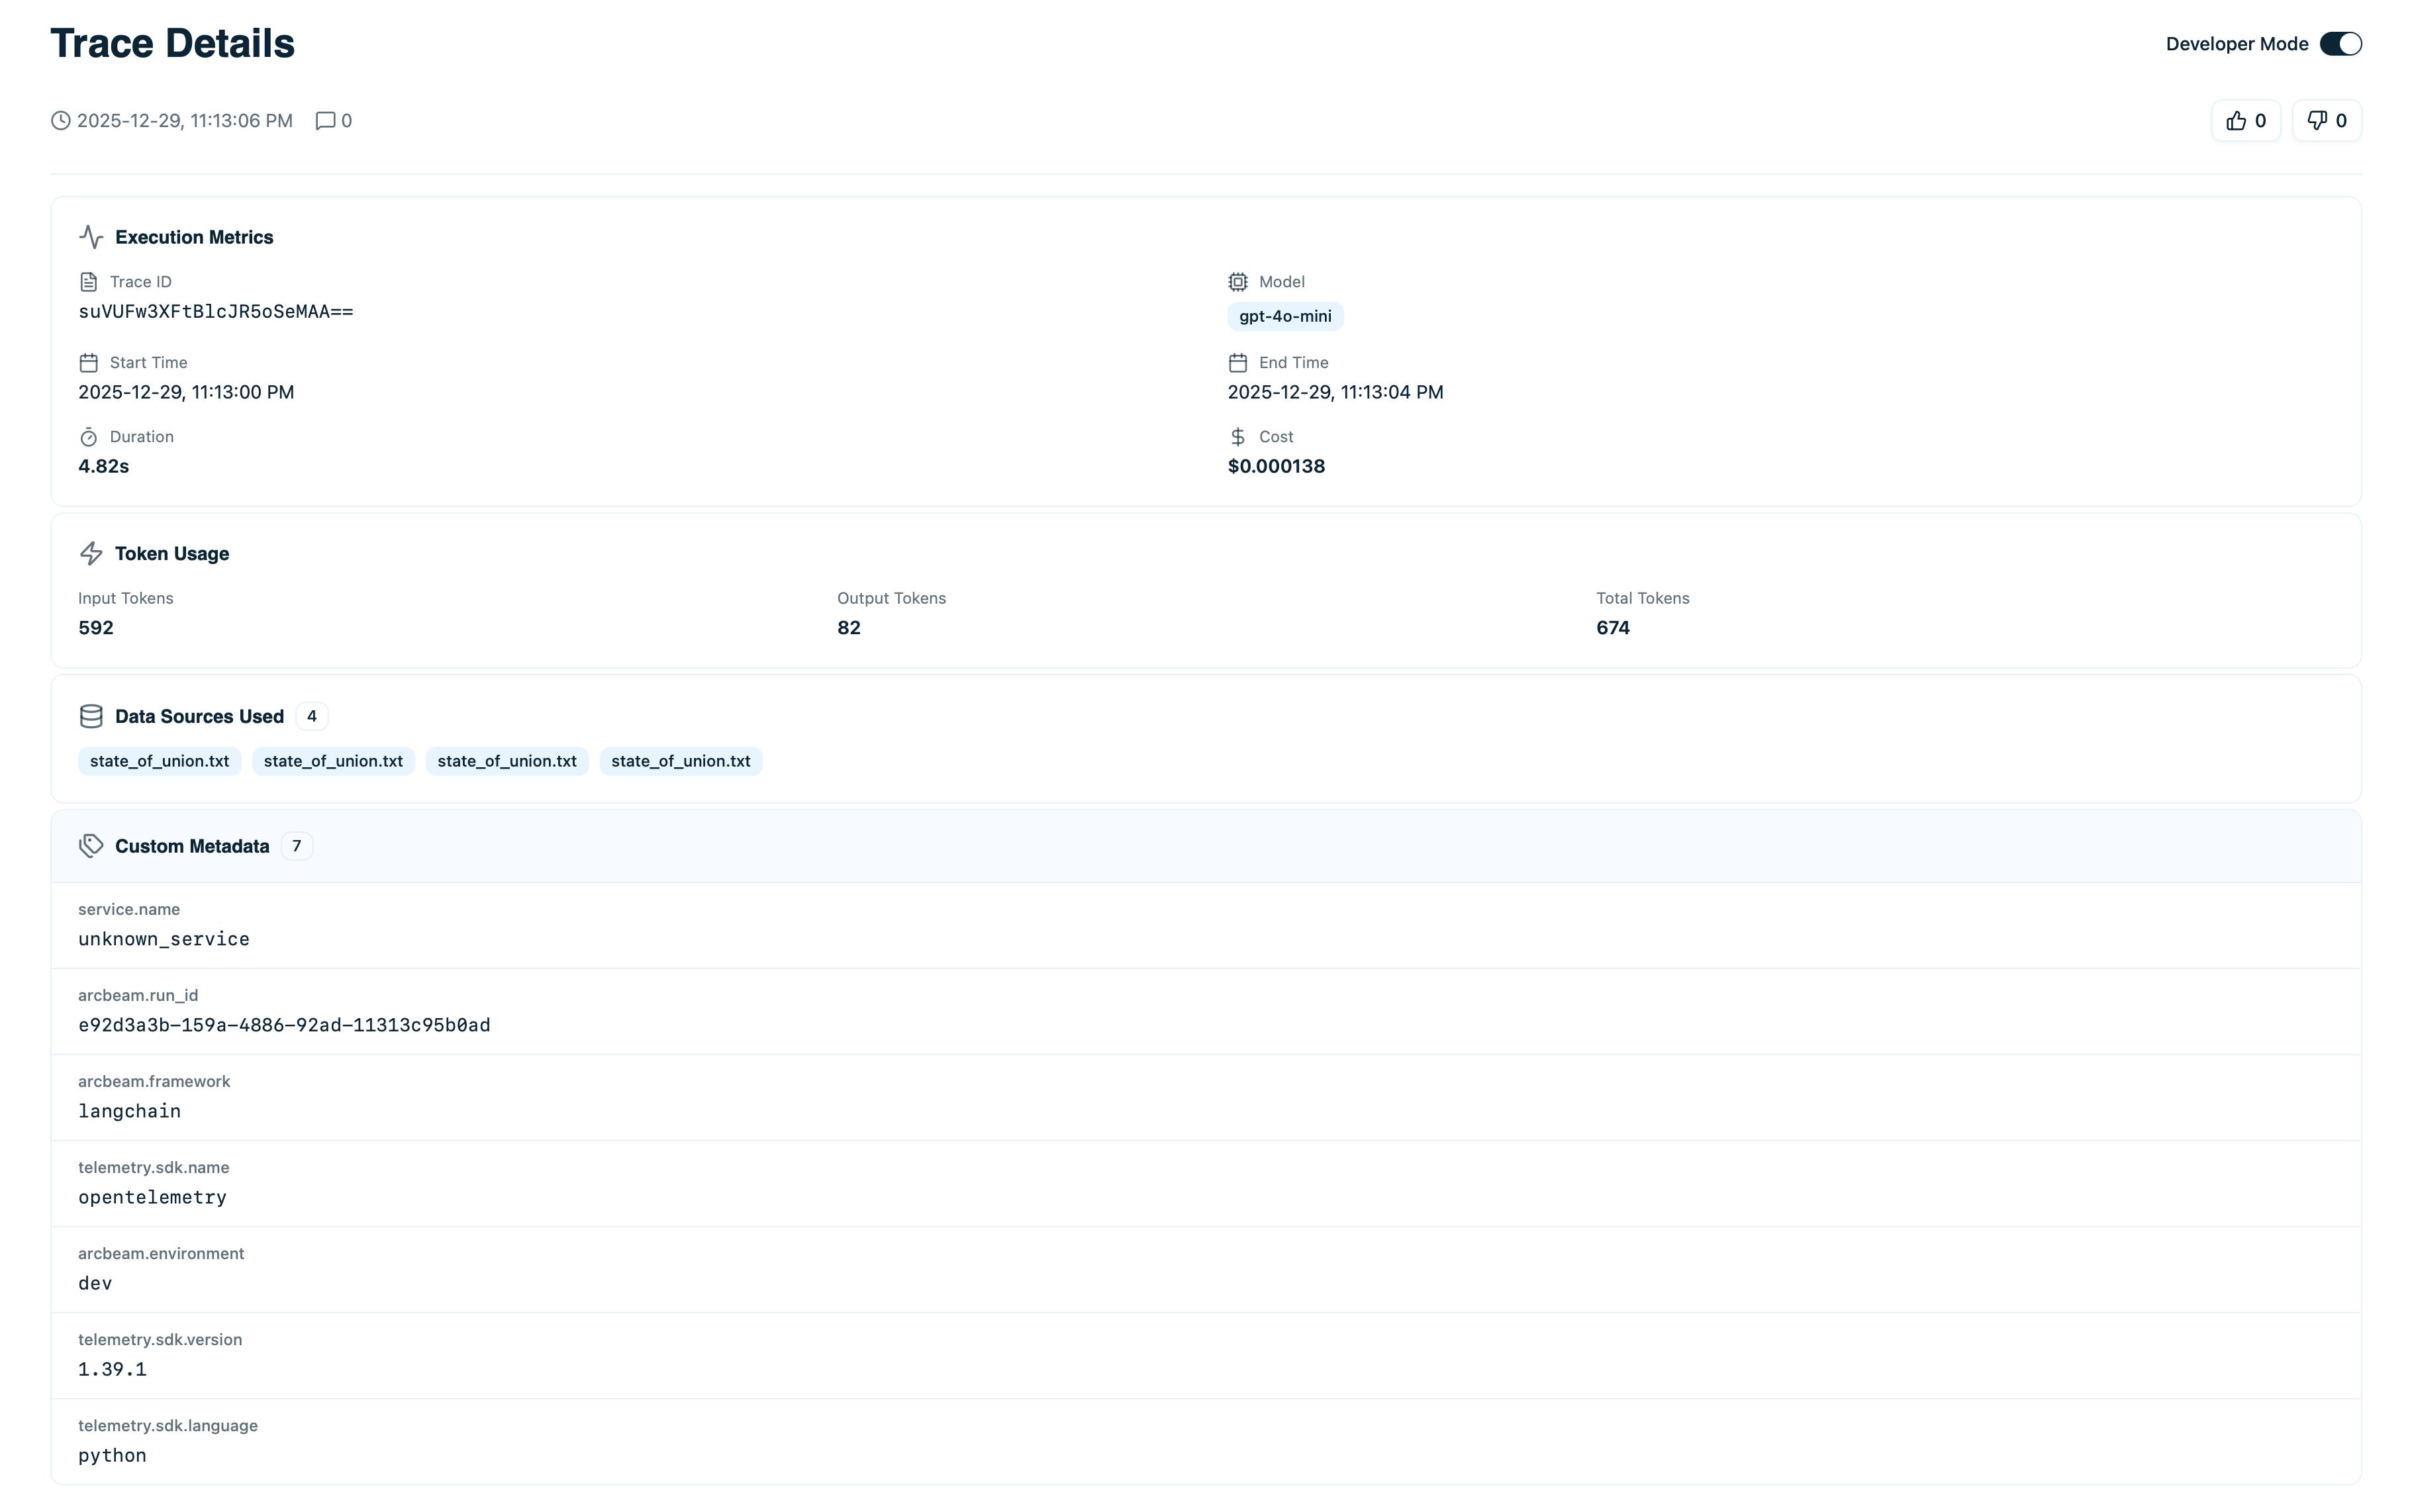 * **Input** - The complete prompt or user question sent to the LLM
* **Output** - The full model response
* **Model** - Which LLM was used (e.g., `gpt-4o-mini`)
* **Status** - Success ✓ or Error ⚠
* **Timestamp** - Exact time this trace occurred
* **Duration** - Total execution time
* **Cost** - Total cost in USD
* **Tokens** - Input tokens + output tokens
## Execution Timeline
For agents or chains with multiple steps, the timeline shows the complete execution flow:
* **Input** - The complete prompt or user question sent to the LLM
* **Output** - The full model response
* **Model** - Which LLM was used (e.g., `gpt-4o-mini`)
* **Status** - Success ✓ or Error ⚠
* **Timestamp** - Exact time this trace occurred
* **Duration** - Total execution time
* **Cost** - Total cost in USD
* **Tokens** - Input tokens + output tokens
## Execution Timeline
For agents or chains with multiple steps, the timeline shows the complete execution flow:
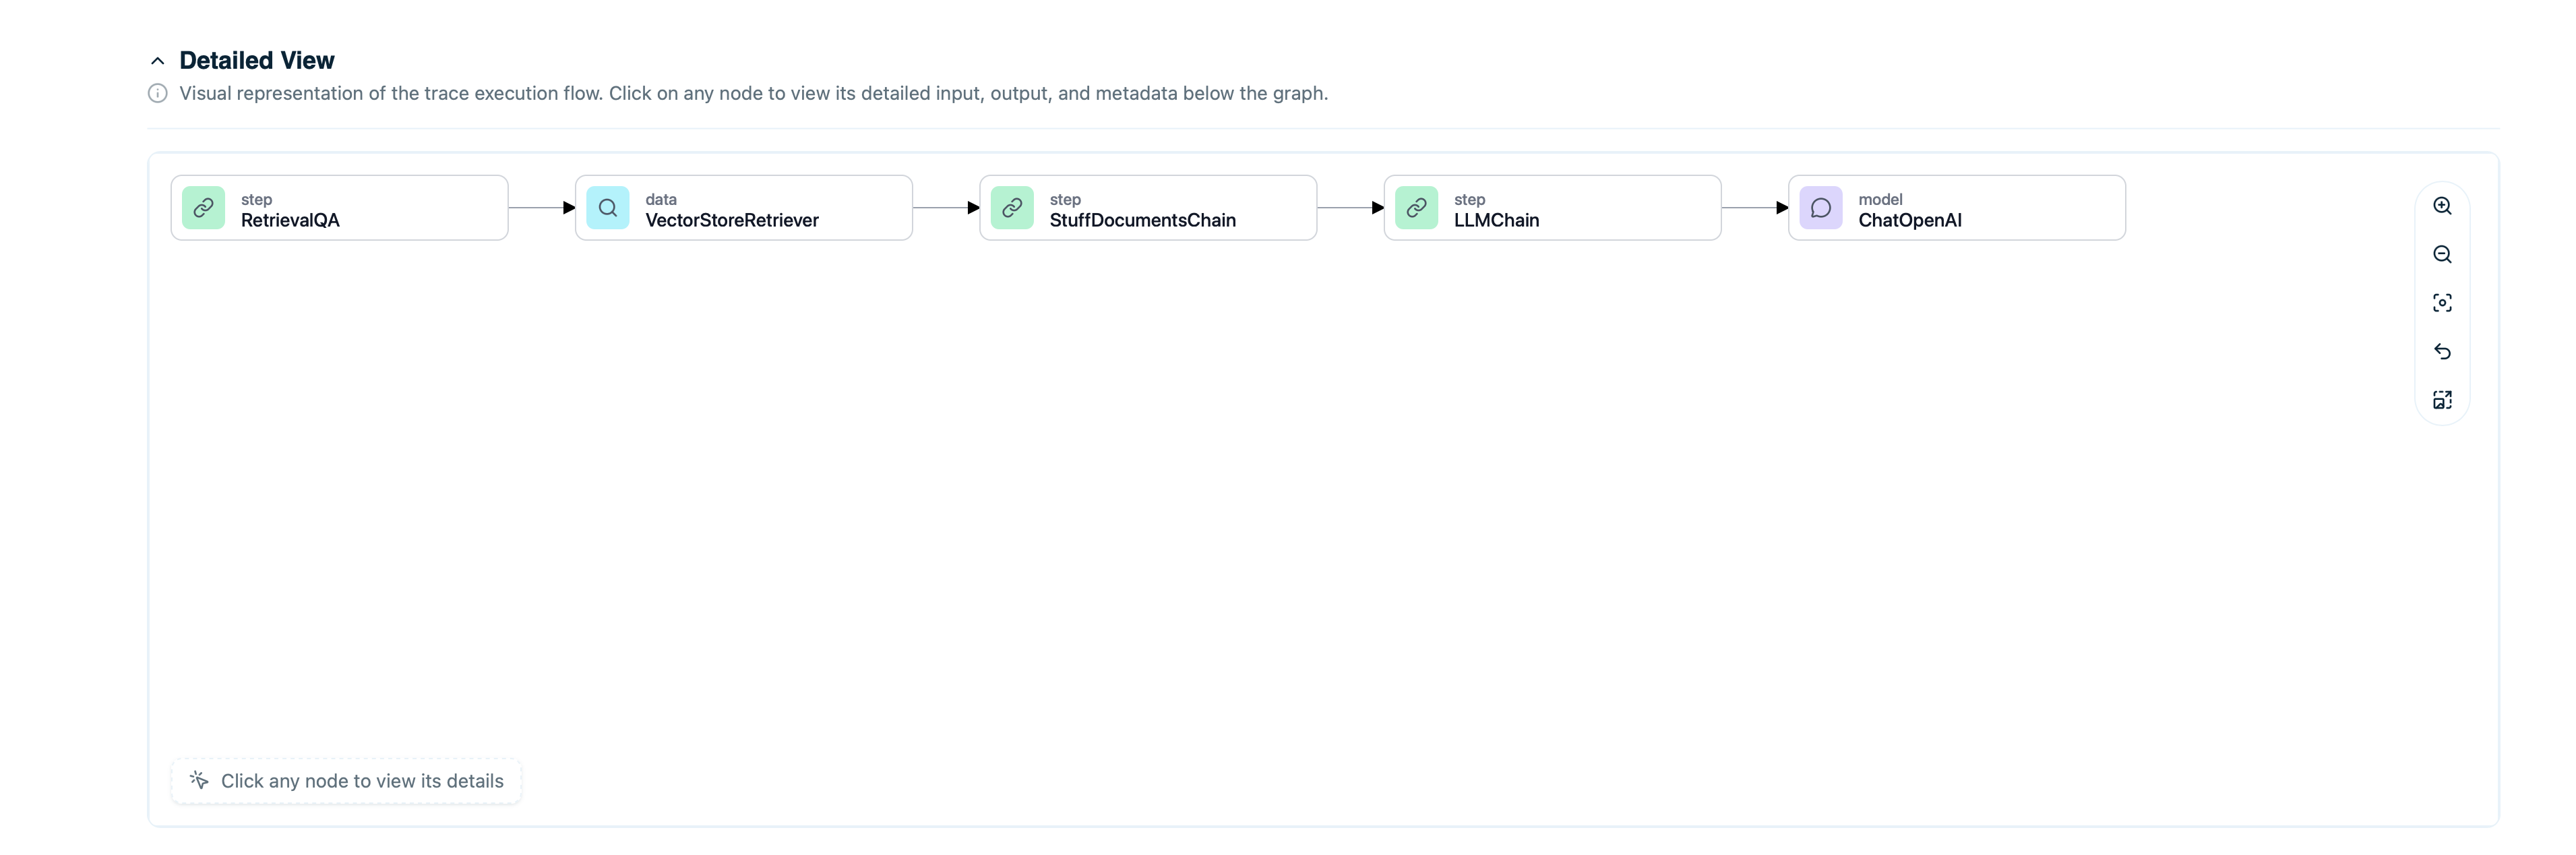 Each node in the timeline represents:
* **LLM calls** - When the model was invoked
* **Tool executions** - When tools/functions were called
* **Retrieval operations** - When documents were fetched
* **Agent steps** - Decision points in the agent workflow
Click on any node to see its details:
* Input to that step
* Output from that step
* Duration and cost for that step
* Tokens used (if LLM call)
### Node Types
Different node types appear with distinct icons:
| Node Type | Icon | Description |
| ------------- | ---- | --------------------------------- |
| **LLM** | 🤖 | Call to a language model |
| **Tool** | 🔧 | Function or tool execution |
| **Retriever** | 📄 | Document retrieval from vector DB |
| **Step** | 📍 | Generic step in workflow |
## Token and Cost Breakdown
See exactly where tokens and costs came from:
### Token Usage
* **Input Tokens** - Tokens in the prompt
* **Output Tokens** - Tokens in the response
* **Total Tokens** - Sum of input + output
For multi-step traces:
* Per-step token counts
* Running total as execution progresses
* Final total at the bottom
### Cost Calculation
Costs are calculated based on:
* Model pricing (per 1M tokens)
* Input token count × input price
* Output token count × output price
Example for `gpt-4o-mini`:
```
Input: 500 tokens × $0.150/1M = $0.000075
Output: 200 tokens × $0.600/1M = $0.000120
Total: $0.000195
```
Multi-step traces show:
* Cost per step
* Cumulative cost
* Total cost for entire trace
## Retrieved Documents
If the trace used RAG (retrieval-augmented generation), you'll see which documents were retrieved:
Each node in the timeline represents:
* **LLM calls** - When the model was invoked
* **Tool executions** - When tools/functions were called
* **Retrieval operations** - When documents were fetched
* **Agent steps** - Decision points in the agent workflow
Click on any node to see its details:
* Input to that step
* Output from that step
* Duration and cost for that step
* Tokens used (if LLM call)
### Node Types
Different node types appear with distinct icons:
| Node Type | Icon | Description |
| ------------- | ---- | --------------------------------- |
| **LLM** | 🤖 | Call to a language model |
| **Tool** | 🔧 | Function or tool execution |
| **Retriever** | 📄 | Document retrieval from vector DB |
| **Step** | 📍 | Generic step in workflow |
## Token and Cost Breakdown
See exactly where tokens and costs came from:
### Token Usage
* **Input Tokens** - Tokens in the prompt
* **Output Tokens** - Tokens in the response
* **Total Tokens** - Sum of input + output
For multi-step traces:
* Per-step token counts
* Running total as execution progresses
* Final total at the bottom
### Cost Calculation
Costs are calculated based on:
* Model pricing (per 1M tokens)
* Input token count × input price
* Output token count × output price
Example for `gpt-4o-mini`:
```
Input: 500 tokens × $0.150/1M = $0.000075
Output: 200 tokens × $0.600/1M = $0.000120
Total: $0.000195
```
Multi-step traces show:
* Cost per step
* Cumulative cost
* Total cost for entire trace
## Retrieved Documents
If the trace used RAG (retrieval-augmented generation), you'll see which documents were retrieved:
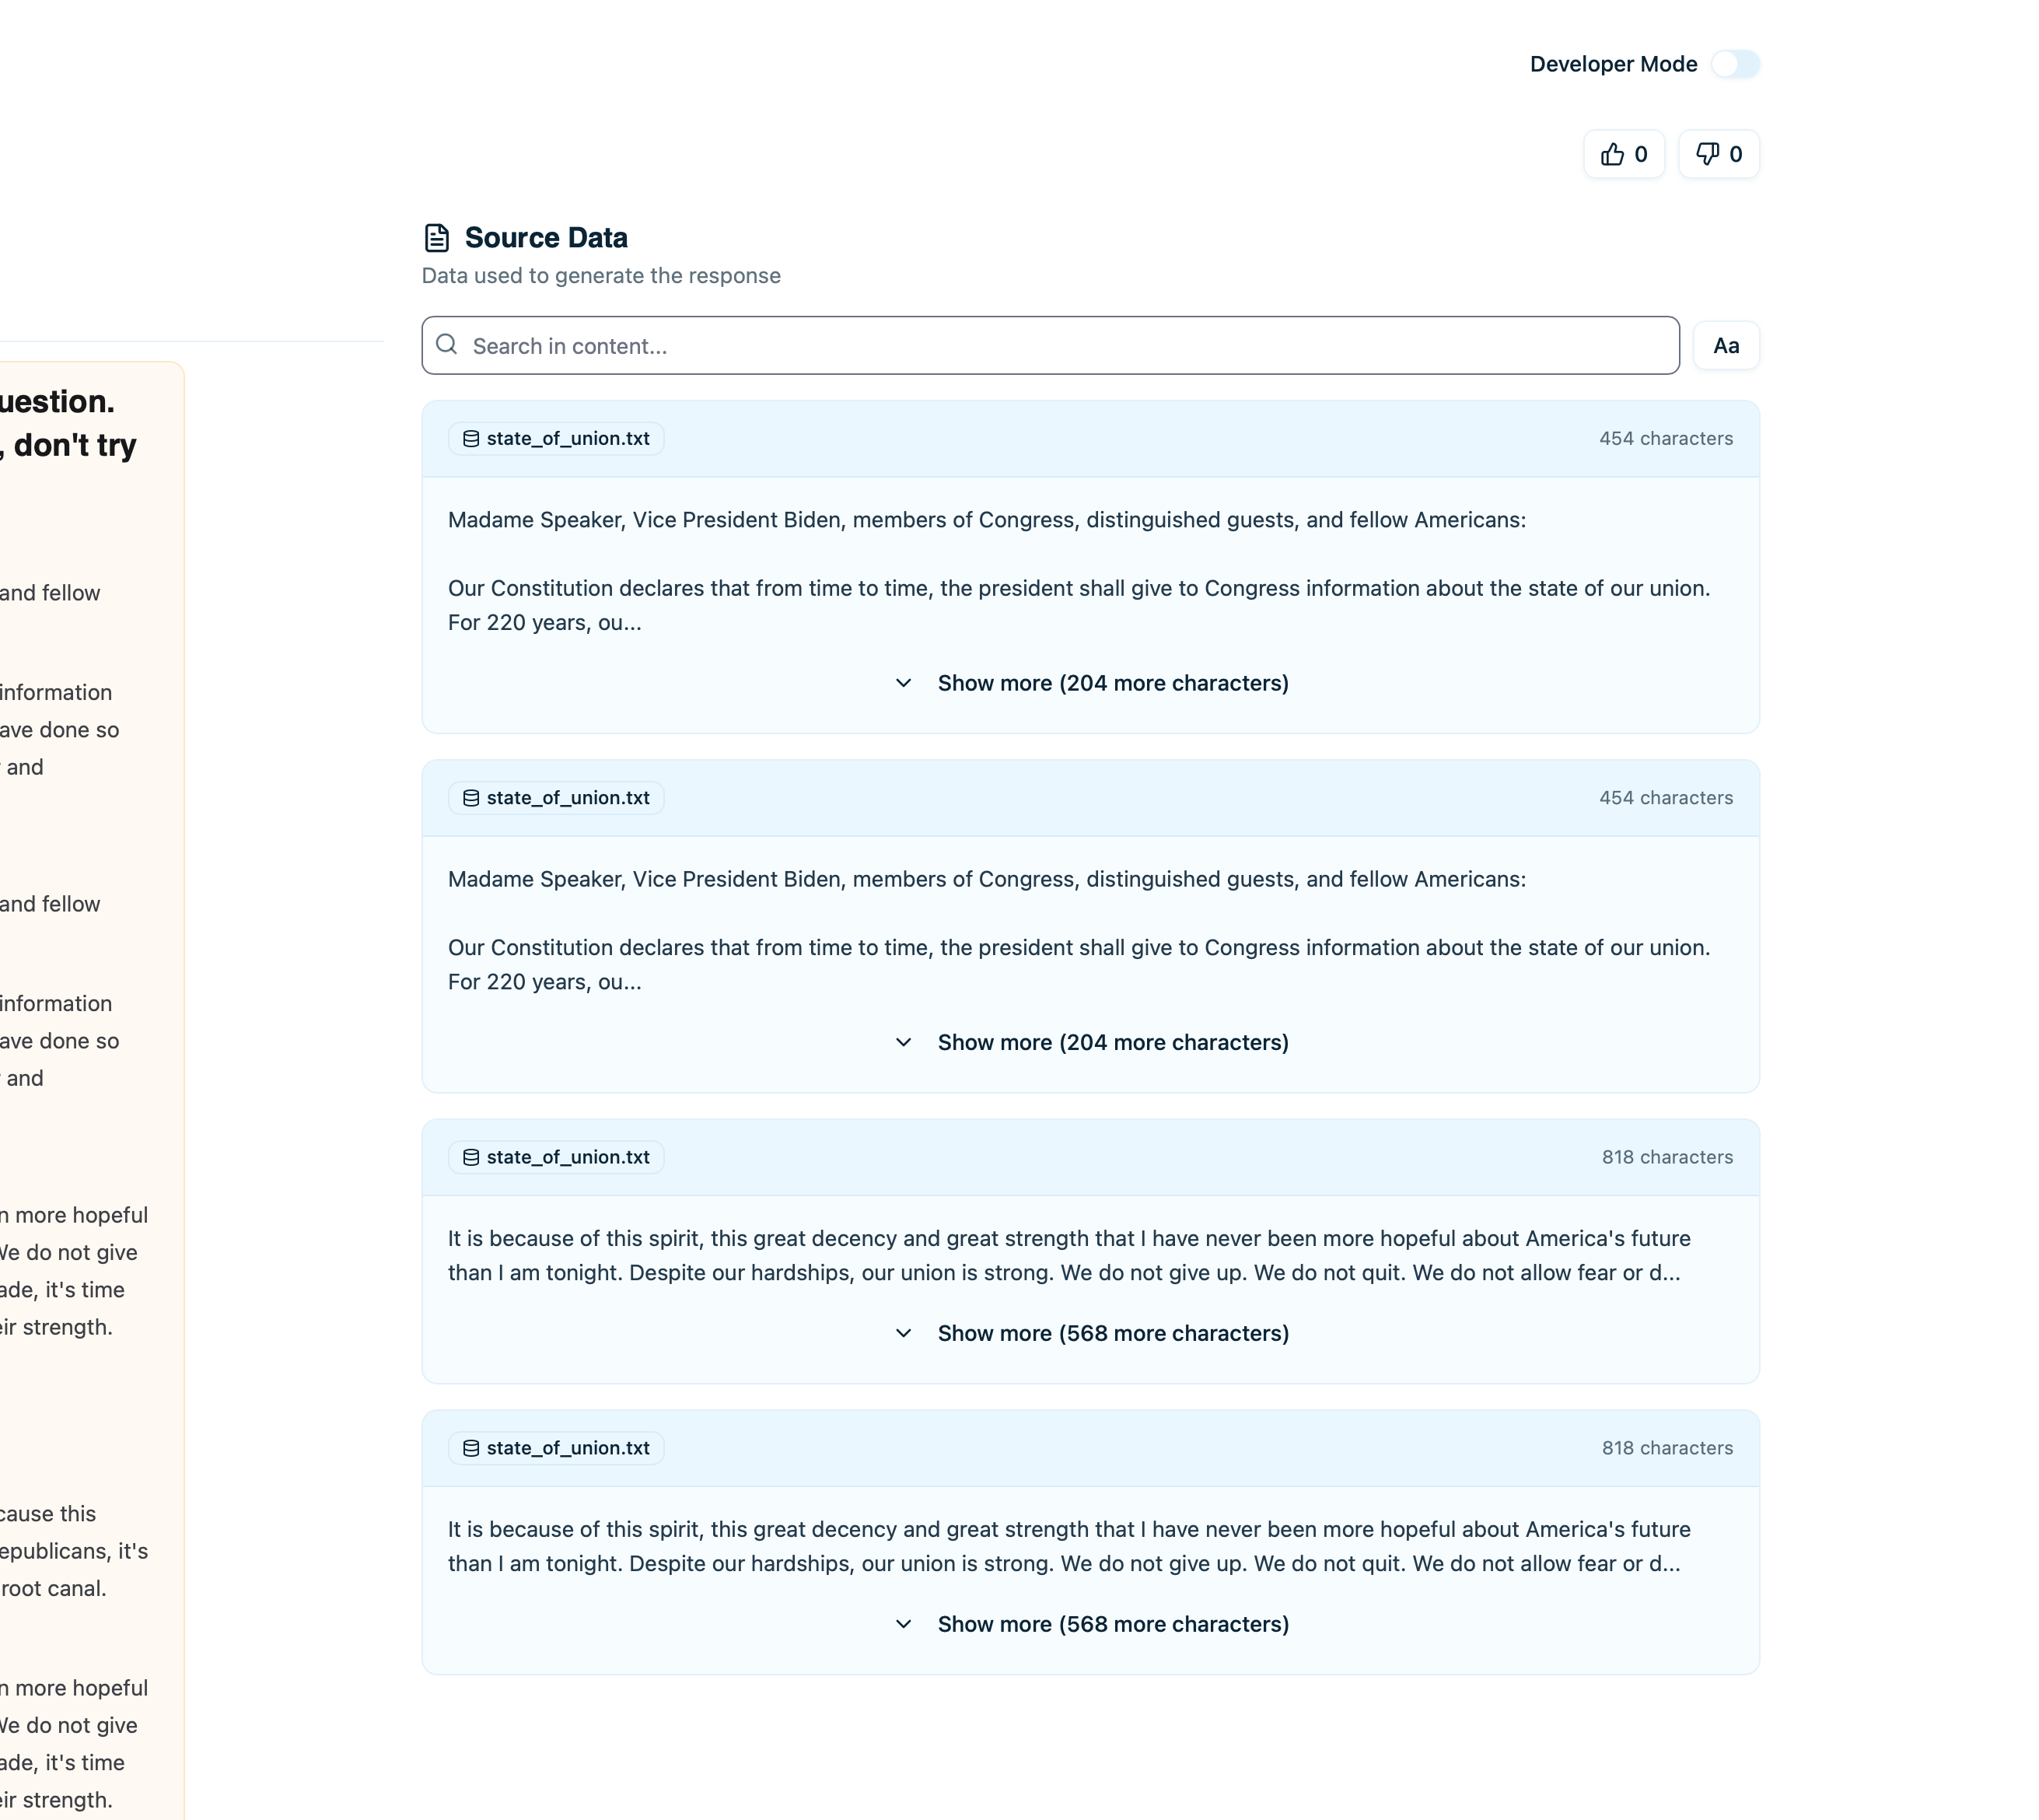 For each retrieved document:
* **Document content** - The text that was retrieved
* **Source** - Where this document came from
* **Relevance score** - How relevant the retriever deemed it (if available)
* **Metadata** - Additional fields like timestamps, tags
Click **View Full Document** to see:
* Complete document text
* Full metadata
* Usage history (how often this doc is retrieved)
[Learn more →](/v0/debugging/trace-issues-to-source-data)
## Error Details
If a trace failed, the error section shows:
* **Error Type** - Exception class (e.g., `RateLimitError`, `Timeout`)
* **Error Message** - What went wrong
* **Node Where Error Occurred** - Which step failed
* **Stack Trace** - Full error traceback (if available)
This helps you:
* Understand why the trace failed
* Identify which component broke
* Fix the root cause
### Common Errors
| Error Type | Meaning | Fix |
| --------------------- | --------------------------------- | ----------------------------------- |
| `RateLimitError` | Too many requests to LLM provider | Implement rate limiting or backoff |
| `AuthenticationError` | Invalid API key | Check your LLM provider API key |
| `Timeout` | Request took too long | Increase timeout or optimize prompt |
| `InvalidRequest` | Malformed request to LLM | Validate input format |
## Feedback and Comments
At the bottom of the trace, see user feedback:
### User Feedback
If feedback tracking is enabled:
* **👍 Thumbs Up** - Positive feedback count
* **👎 Thumbs Down** - Negative feedback count
Click to see which users gave feedback and when.
### Comments
Team members can leave comments on traces:
* Click **Add Comment**
* Type your note or observation
* Comments are visible to all team members with access
Use comments for:
* Noting issues to investigate
* Documenting why something happened
* Collaborating on debugging
* Marking traces for review
[Learn more →](/v0/collaboration/review-traces-together)
## Sharing a Trace
To share a specific trace with team members:
1. Click **Copy Link** button
2. Share the URL
3. Anyone with project access can view
The URL looks like:
```
http://platform.arcbeam.ai/projects/{project-id}/traces/{trace-id}
```
## Comparing Traces
To compare multiple traces side-by-side:
1. Open first trace
2. Click **Compare** button
3. Select second trace
4. View differences in inputs, outputs, costs, and execution flow
Useful for:
* A/B testing different prompts
* Comparing model performance
* Understanding why some queries cost more
* Debugging inconsistent behavior
## Viewing Source Data
If you've connected data sources, click on a retrieved document to see:
* **Full document text** - Complete content
* **Source attribution** - Original file/URL
* **Metadata** - All fields from your vector database
* **Usage stats** - How often this document is retrieved
* **Related traces** - Other traces that used this document
This connects the dots between what the LLM said and where the information came from.
## What to Look For
### When Debugging Errors
1. **Check the error message** - What exactly failed?
2. **Find the failing node** - Which step broke?
3. **Review the input to that node** - Was the input malformed?
4. **Check recent code changes** - Did you change something related?
### When Optimizing Costs
1. **Look at token breakdown** - Which steps used most tokens?
2. **Review input length** - Can you shorten the prompt?
3. **Check retrieved documents** - Are you retrieving too many?
4. **Compare with cheaper models** - Could you use `gpt-4o-mini` instead of `gpt-4o`?
### When Investigating User Reports
1. **Read input and output** - Does the response make sense?
2. **Check retrieved documents** - Did it get the right information?
3. **Look for errors** - Did anything fail silently?
4. **Review timeline** - Was there unusual latency?
## Best Practices
### Add Comments for Context
When you find something interesting:
* Leave a comment explaining what you found
* Tag team members who should know
* Document the resolution if you fix it
### Compare Similar Traces
If you see inconsistent behavior:
* Find a good trace and a bad trace
* Compare them side-by-side
* Identify what's different
### Check Retrieved Documents
For RAG traces:
* Always verify the right documents were retrieved
* If output is wrong, often the retrieved docs are wrong
* Update your knowledge base if needed
## Next Steps
Understand document retrieval in detail
Organize traces for review sessions
Track and fix errors systematically
Optimize costs based on trace data
For each retrieved document:
* **Document content** - The text that was retrieved
* **Source** - Where this document came from
* **Relevance score** - How relevant the retriever deemed it (if available)
* **Metadata** - Additional fields like timestamps, tags
Click **View Full Document** to see:
* Complete document text
* Full metadata
* Usage history (how often this doc is retrieved)
[Learn more →](/v0/debugging/trace-issues-to-source-data)
## Error Details
If a trace failed, the error section shows:
* **Error Type** - Exception class (e.g., `RateLimitError`, `Timeout`)
* **Error Message** - What went wrong
* **Node Where Error Occurred** - Which step failed
* **Stack Trace** - Full error traceback (if available)
This helps you:
* Understand why the trace failed
* Identify which component broke
* Fix the root cause
### Common Errors
| Error Type | Meaning | Fix |
| --------------------- | --------------------------------- | ----------------------------------- |
| `RateLimitError` | Too many requests to LLM provider | Implement rate limiting or backoff |
| `AuthenticationError` | Invalid API key | Check your LLM provider API key |
| `Timeout` | Request took too long | Increase timeout or optimize prompt |
| `InvalidRequest` | Malformed request to LLM | Validate input format |
## Feedback and Comments
At the bottom of the trace, see user feedback:
### User Feedback
If feedback tracking is enabled:
* **👍 Thumbs Up** - Positive feedback count
* **👎 Thumbs Down** - Negative feedback count
Click to see which users gave feedback and when.
### Comments
Team members can leave comments on traces:
* Click **Add Comment**
* Type your note or observation
* Comments are visible to all team members with access
Use comments for:
* Noting issues to investigate
* Documenting why something happened
* Collaborating on debugging
* Marking traces for review
[Learn more →](/v0/collaboration/review-traces-together)
## Sharing a Trace
To share a specific trace with team members:
1. Click **Copy Link** button
2. Share the URL
3. Anyone with project access can view
The URL looks like:
```
http://platform.arcbeam.ai/projects/{project-id}/traces/{trace-id}
```
## Comparing Traces
To compare multiple traces side-by-side:
1. Open first trace
2. Click **Compare** button
3. Select second trace
4. View differences in inputs, outputs, costs, and execution flow
Useful for:
* A/B testing different prompts
* Comparing model performance
* Understanding why some queries cost more
* Debugging inconsistent behavior
## Viewing Source Data
If you've connected data sources, click on a retrieved document to see:
* **Full document text** - Complete content
* **Source attribution** - Original file/URL
* **Metadata** - All fields from your vector database
* **Usage stats** - How often this document is retrieved
* **Related traces** - Other traces that used this document
This connects the dots between what the LLM said and where the information came from.
## What to Look For
### When Debugging Errors
1. **Check the error message** - What exactly failed?
2. **Find the failing node** - Which step broke?
3. **Review the input to that node** - Was the input malformed?
4. **Check recent code changes** - Did you change something related?
### When Optimizing Costs
1. **Look at token breakdown** - Which steps used most tokens?
2. **Review input length** - Can you shorten the prompt?
3. **Check retrieved documents** - Are you retrieving too many?
4. **Compare with cheaper models** - Could you use `gpt-4o-mini` instead of `gpt-4o`?
### When Investigating User Reports
1. **Read input and output** - Does the response make sense?
2. **Check retrieved documents** - Did it get the right information?
3. **Look for errors** - Did anything fail silently?
4. **Review timeline** - Was there unusual latency?
## Best Practices
### Add Comments for Context
When you find something interesting:
* Leave a comment explaining what you found
* Tag team members who should know
* Document the resolution if you fix it
### Compare Similar Traces
If you see inconsistent behavior:
* Find a good trace and a bad trace
* Compare them side-by-side
* Identify what's different
### Check Retrieved Documents
For RAG traces:
* Always verify the right documents were retrieved
* If output is wrong, often the retrieved docs are wrong
* Update your knowledge base if needed
## Next Steps
Understand document retrieval in detail
Organize traces for review sessions
Track and fix errors systematically
Optimize costs based on trace data