Overview Section
At the top of the trace details page, you’ll see summary information: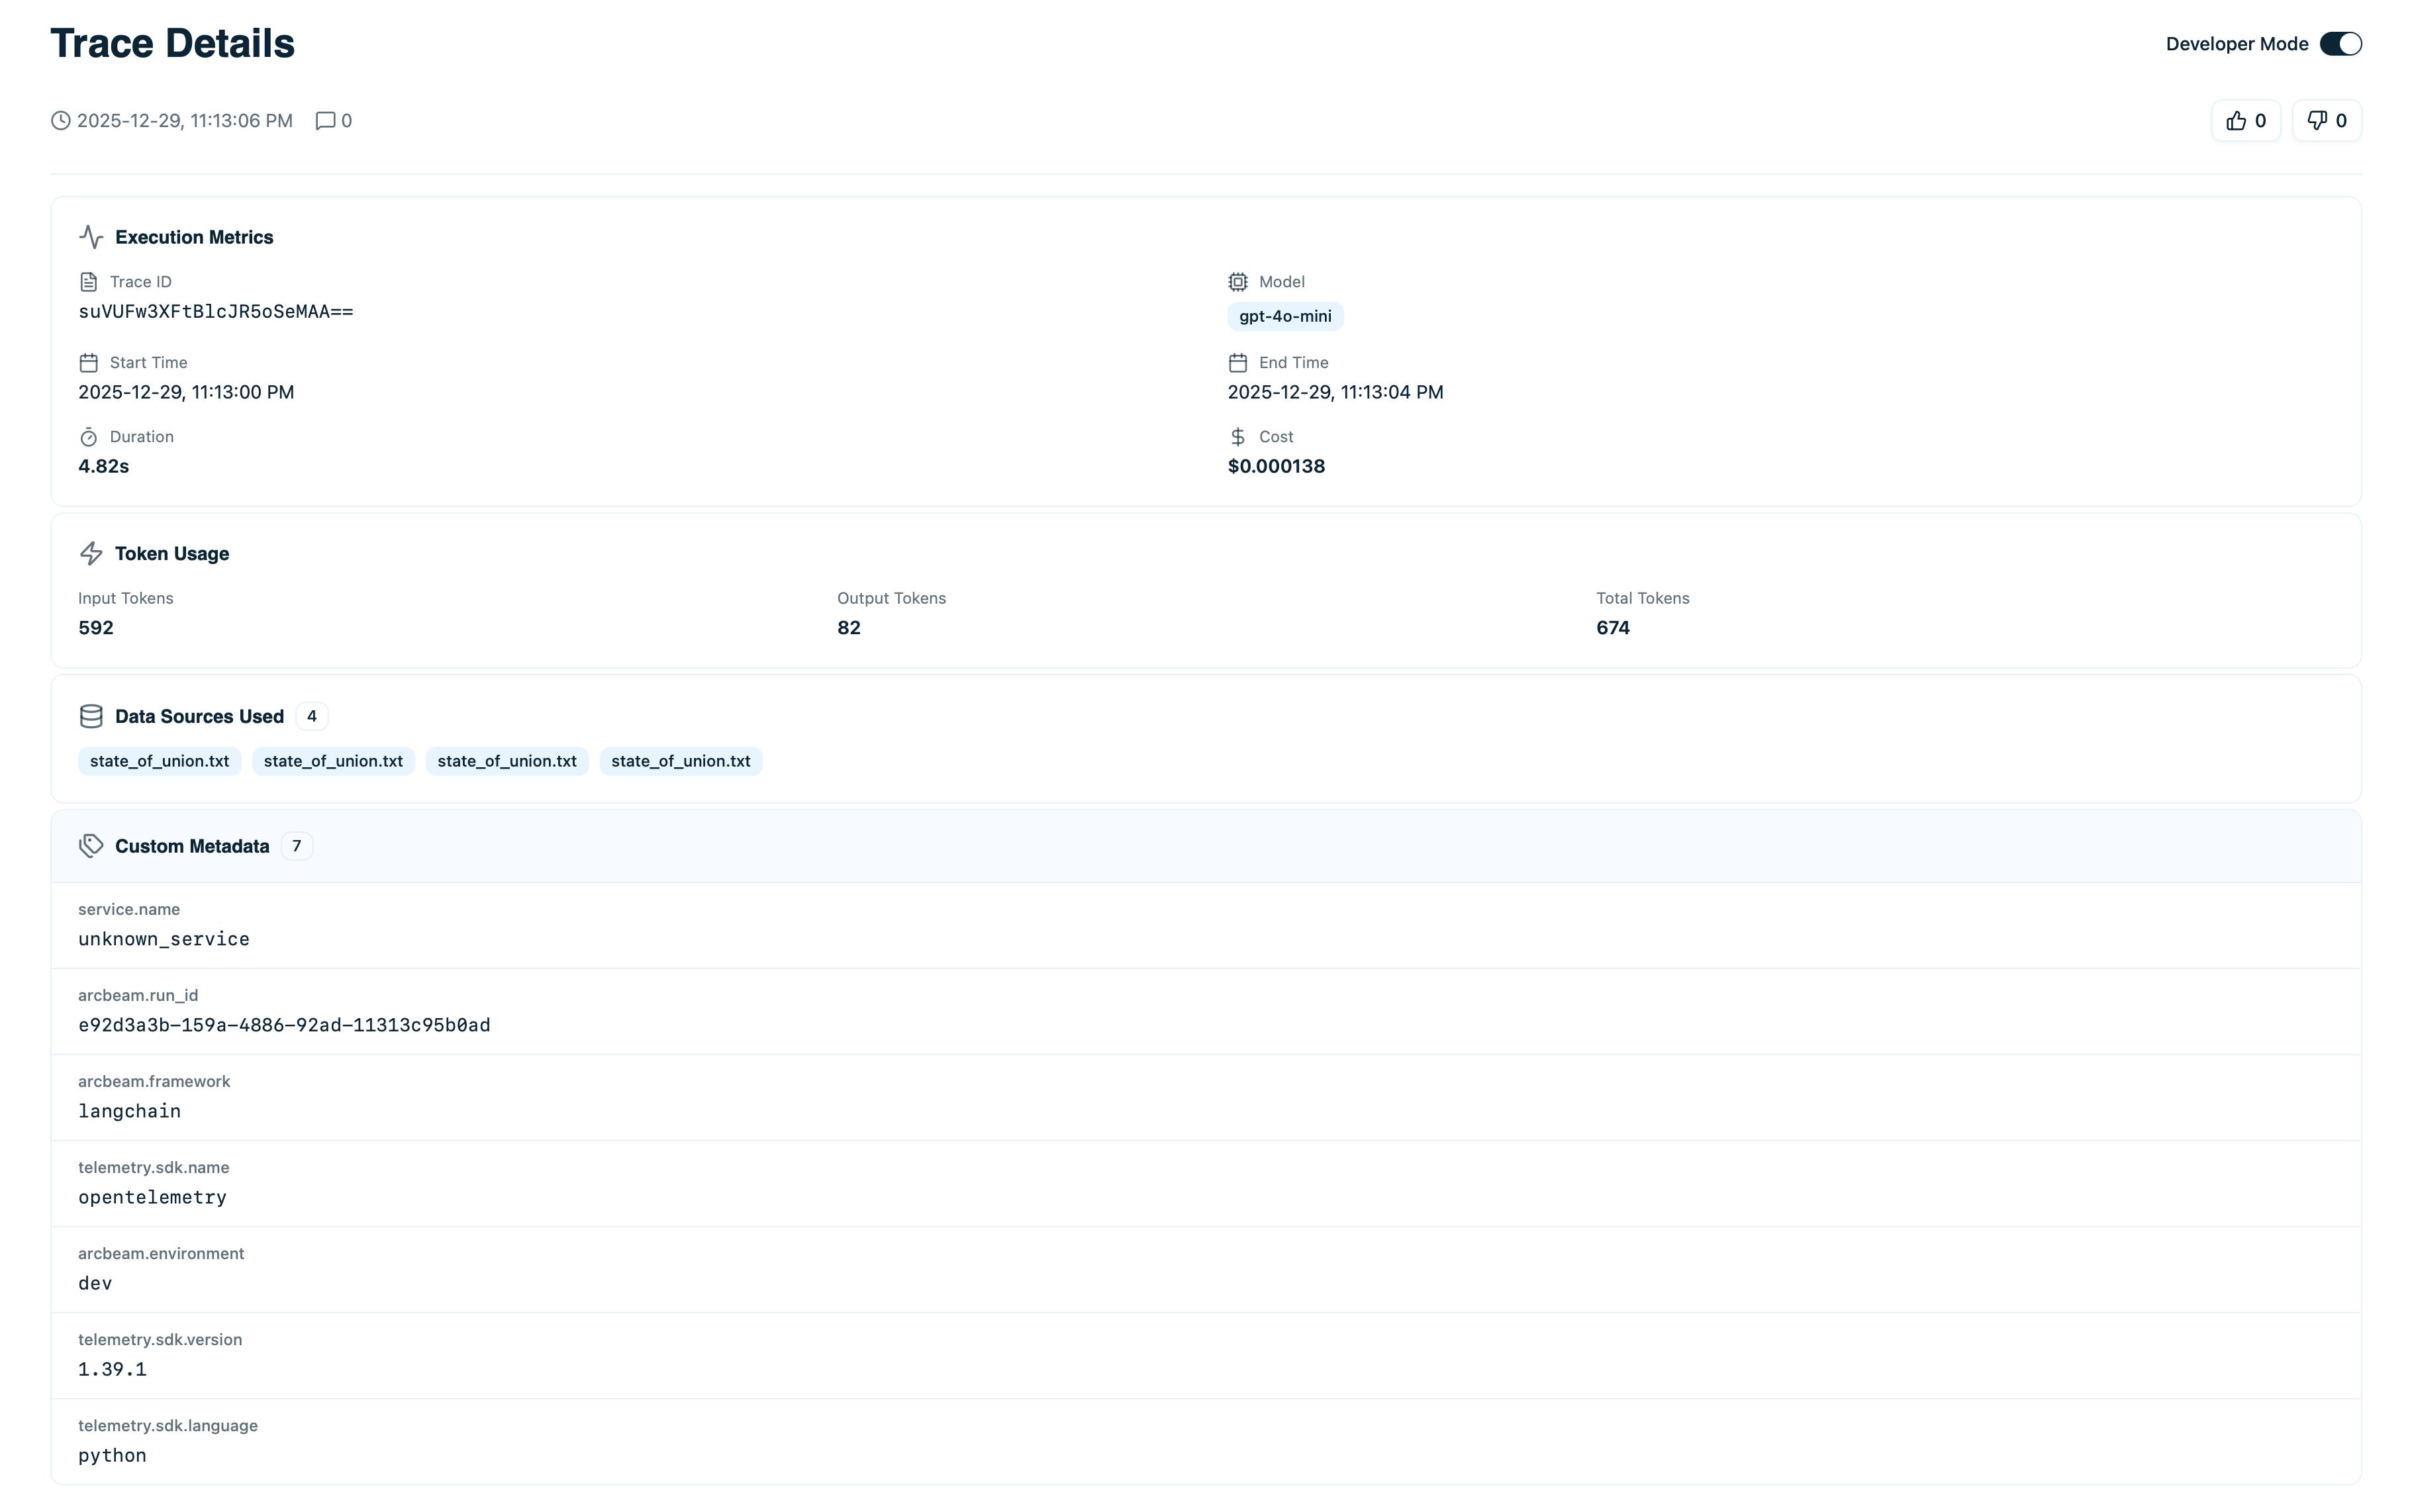
- Input - The complete prompt or user question sent to the LLM
- Output - The full model response
- Model - Which LLM was used (e.g.,
gpt-4o-mini) - Status - Success ✓ or Error ⚠
- Timestamp - Exact time this trace occurred
- Duration - Total execution time
- Cost - Total cost in USD
- Tokens - Input tokens + output tokens
Execution Timeline
For agents or chains with multiple steps, the timeline shows the complete execution flow: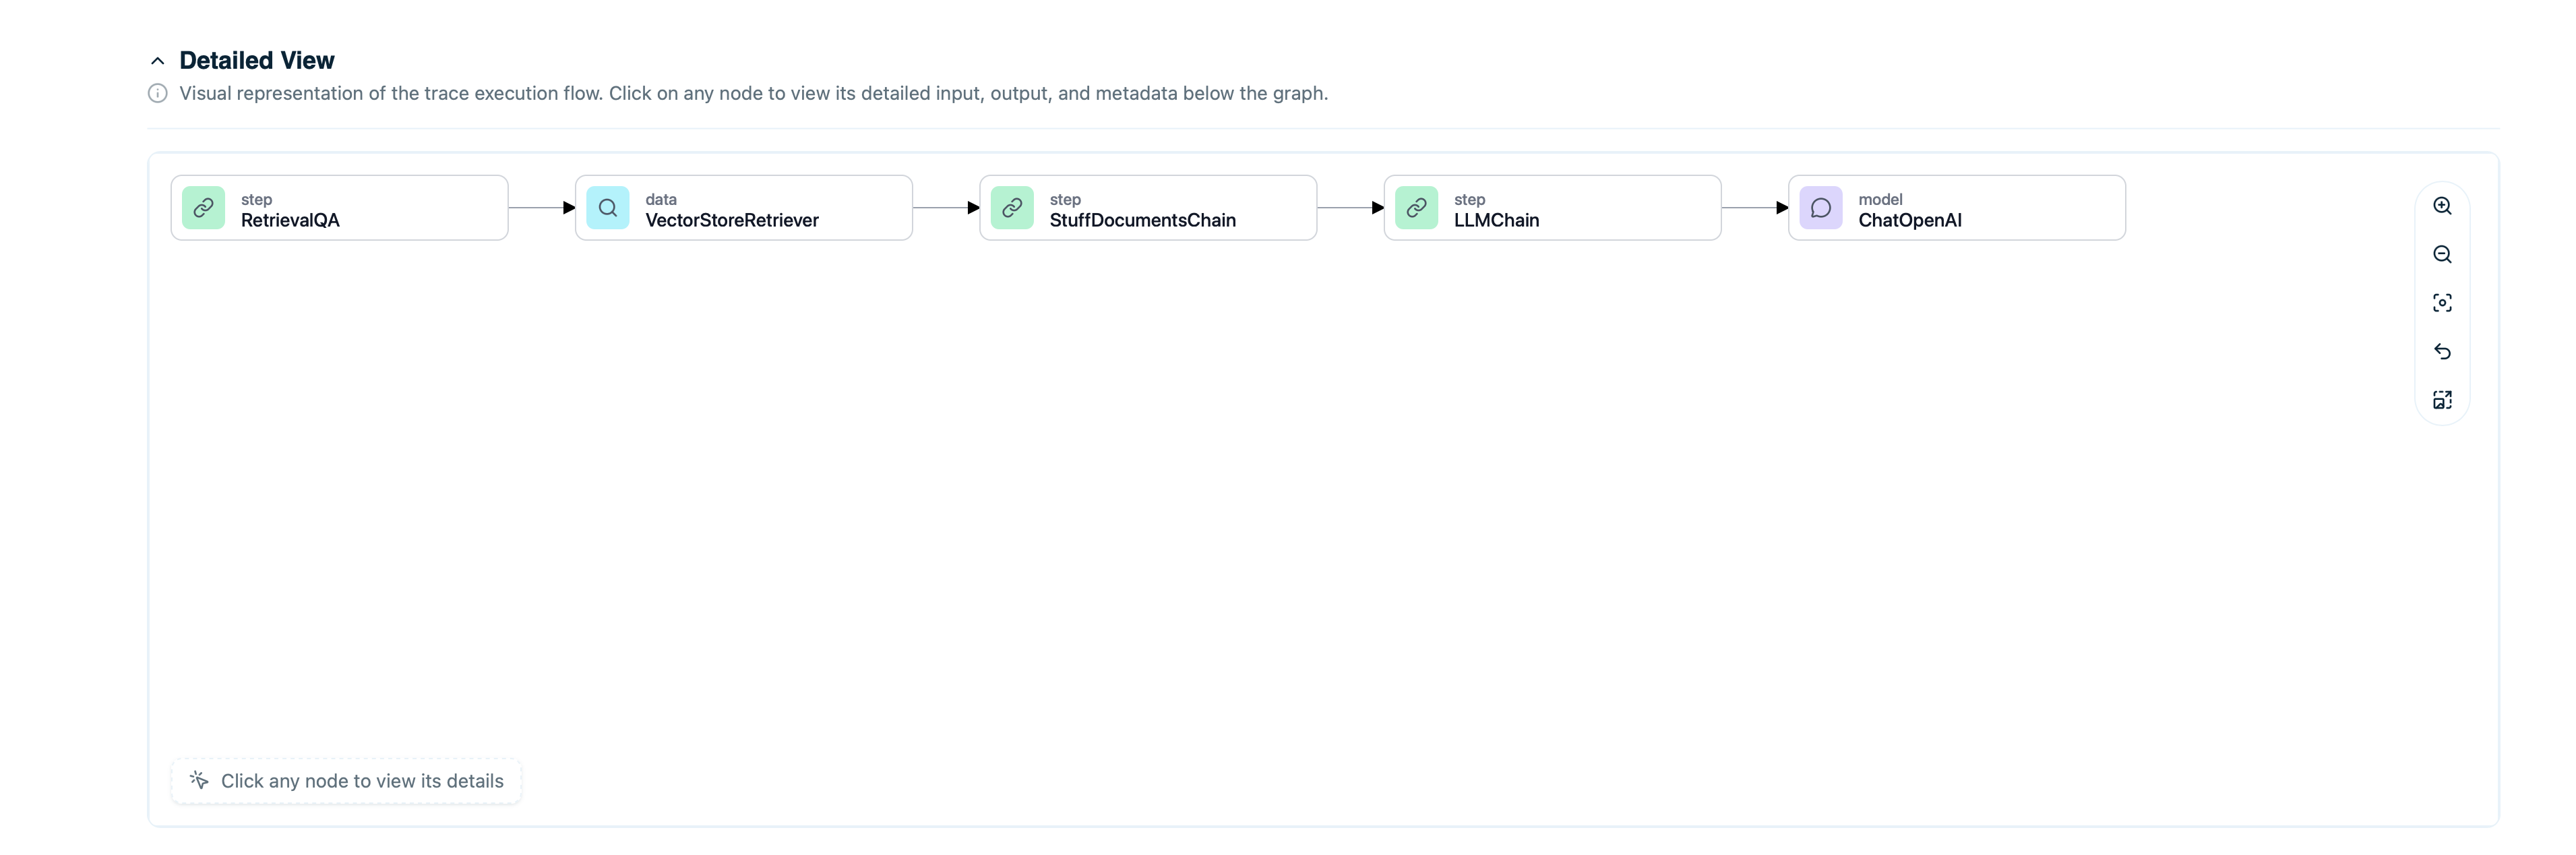
- LLM calls - When the model was invoked
- Tool executions - When tools/functions were called
- Retrieval operations - When documents were fetched
- Agent steps - Decision points in the agent workflow
- Input to that step
- Output from that step
- Duration and cost for that step
- Tokens used (if LLM call)
Node Types
Different node types appear with distinct icons:| Node Type | Icon | Description |
|---|---|---|
| LLM | 🤖 | Call to a language model |
| Tool | 🔧 | Function or tool execution |
| Retriever | 📄 | Document retrieval from vector DB |
| Step | 📍 | Generic step in workflow |
Token and Cost Breakdown
See exactly where tokens and costs came from:Token Usage
- Input Tokens - Tokens in the prompt
- Output Tokens - Tokens in the response
- Total Tokens - Sum of input + output
- Per-step token counts
- Running total as execution progresses
- Final total at the bottom
Cost Calculation
Costs are calculated based on:- Model pricing (per 1M tokens)
- Input token count × input price
- Output token count × output price
gpt-4o-mini:
- Cost per step
- Cumulative cost
- Total cost for entire trace
Retrieved Documents
If the trace used RAG (retrieval-augmented generation), you’ll see which documents were retrieved: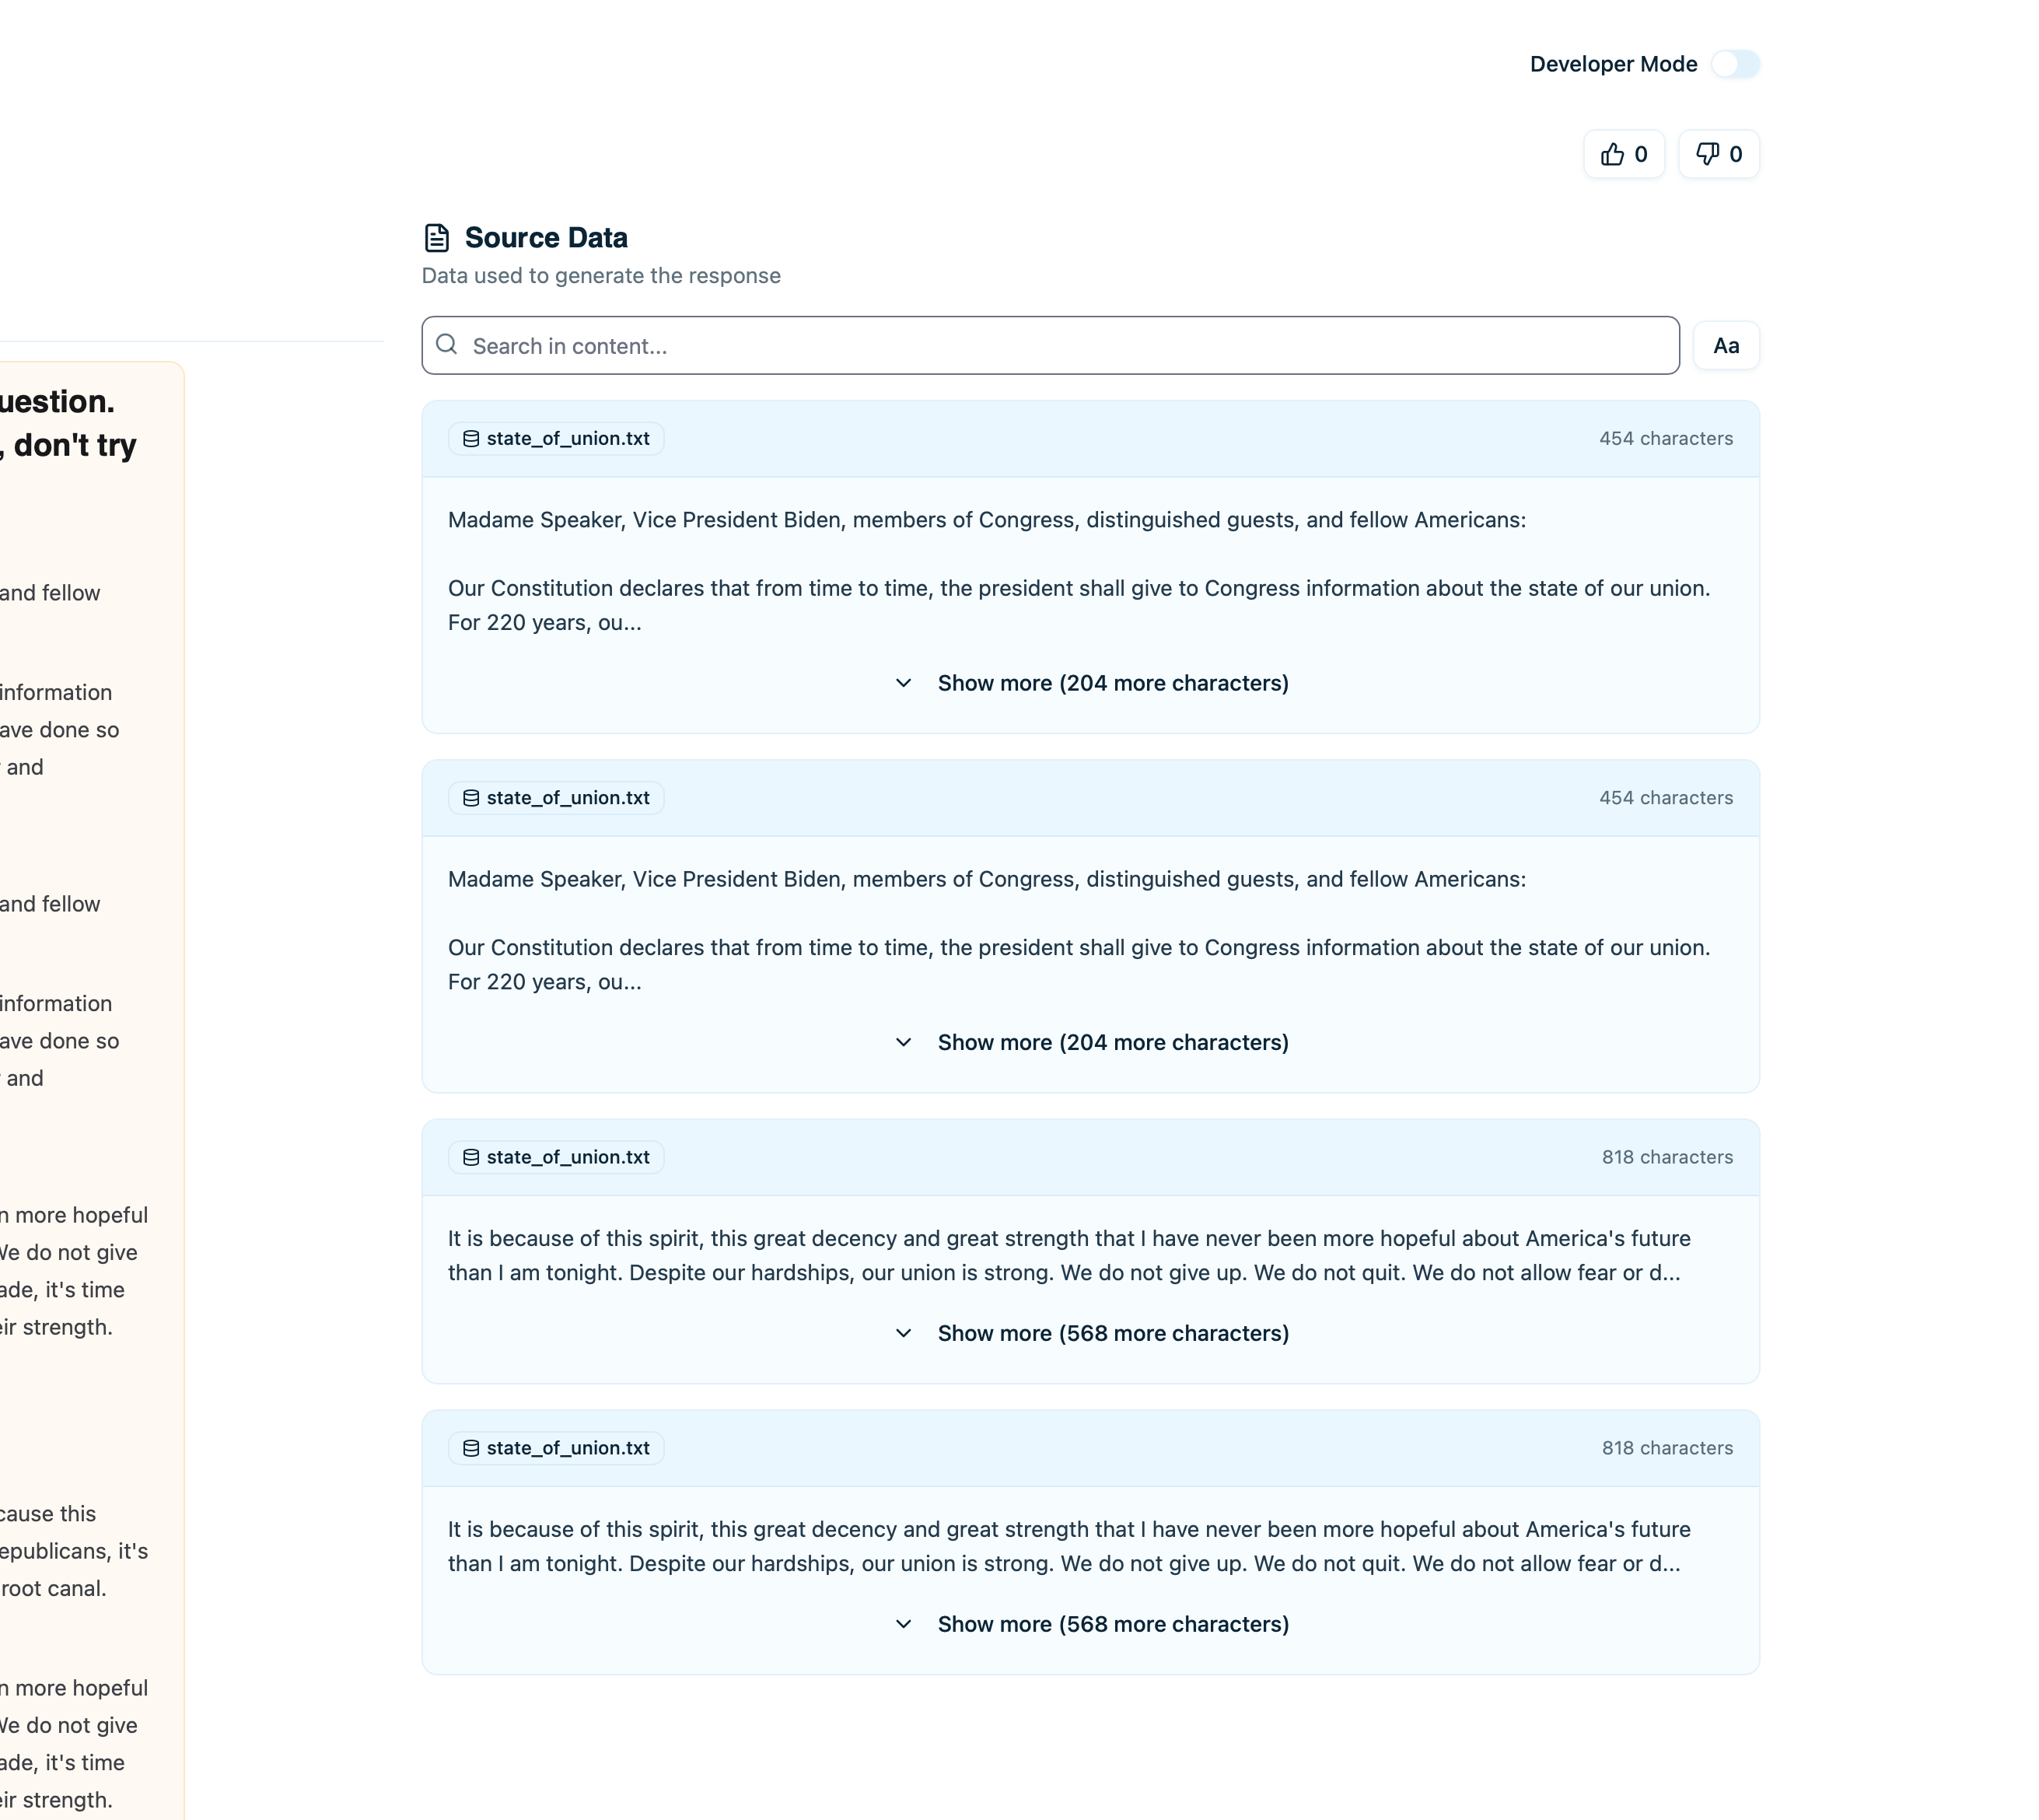
- Document content - The text that was retrieved
- Source - Where this document came from
- Relevance score - How relevant the retriever deemed it (if available)
- Metadata - Additional fields like timestamps, tags
- Complete document text
- Full metadata
- Usage history (how often this doc is retrieved)
Error Details
If a trace failed, the error section shows:- Error Type - Exception class (e.g.,
RateLimitError,Timeout) - Error Message - What went wrong
- Node Where Error Occurred - Which step failed
- Stack Trace - Full error traceback (if available)
- Understand why the trace failed
- Identify which component broke
- Fix the root cause
Common Errors
| Error Type | Meaning | Fix |
|---|---|---|
RateLimitError | Too many requests to LLM provider | Implement rate limiting or backoff |
AuthenticationError | Invalid API key | Check your LLM provider API key |
Timeout | Request took too long | Increase timeout or optimize prompt |
InvalidRequest | Malformed request to LLM | Validate input format |
Feedback and Comments
At the bottom of the trace, see user feedback:User Feedback
If feedback tracking is enabled:- 👍 Thumbs Up - Positive feedback count
- 👎 Thumbs Down - Negative feedback count
Comments
Team members can leave comments on traces:- Click Add Comment
- Type your note or observation
- Comments are visible to all team members with access
- Noting issues to investigate
- Documenting why something happened
- Collaborating on debugging
- Marking traces for review
Sharing a Trace
To share a specific trace with team members:- Click Copy Link button
- Share the URL
- Anyone with project access can view
Comparing Traces
To compare multiple traces side-by-side:- Open first trace
- Click Compare button
- Select second trace
- View differences in inputs, outputs, costs, and execution flow
- A/B testing different prompts
- Comparing model performance
- Understanding why some queries cost more
- Debugging inconsistent behavior
Viewing Source Data
If you’ve connected data sources, click on a retrieved document to see:- Full document text - Complete content
- Source attribution - Original file/URL
- Metadata - All fields from your vector database
- Usage stats - How often this document is retrieved
- Related traces - Other traces that used this document
What to Look For
When Debugging Errors
- Check the error message - What exactly failed?
- Find the failing node - Which step broke?
- Review the input to that node - Was the input malformed?
- Check recent code changes - Did you change something related?
When Optimizing Costs
- Look at token breakdown - Which steps used most tokens?
- Review input length - Can you shorten the prompt?
- Check retrieved documents - Are you retrieving too many?
- Compare with cheaper models - Could you use
gpt-4o-miniinstead ofgpt-4o?
When Investigating User Reports
- Read input and output - Does the response make sense?
- Check retrieved documents - Did it get the right information?
- Look for errors - Did anything fail silently?
- Review timeline - Was there unusual latency?
Best Practices
Add Comments for Context
When you find something interesting:- Leave a comment explaining what you found
- Tag team members who should know
- Document the resolution if you fix it
Compare Similar Traces
If you see inconsistent behavior:- Find a good trace and a bad trace
- Compare them side-by-side
- Identify what’s different
Check Retrieved Documents
For RAG traces:- Always verify the right documents were retrieved
- If output is wrong, often the retrieved docs are wrong
- Update your knowledge base if needed
Next Steps
Retrieved Documents
Understand document retrieval in detail
Collections
Organize traces for review sessions
Observability
Track and fix errors systematically
Cost Optimization
Optimize costs based on trace data