What Gets Captured
Graph Executions
Graph Executions
Complete workflow from start to finish with full execution tree
Node Executions
Node Executions
Each node in your graph with inputs, outputs, and state transformations
State Changes
State Changes
How evolves through the graph at each step
LLM Calls
LLM Calls
Model invocations within nodes with prompts, responses, and costs
Tool Calls
Tool Calls
External API calls and function executions within nodes
Conditional Edges
Conditional Edges
Which paths the agent took and why, including decision logic
Timing Data
Timing Data
Duration for each node and transition to identify bottlenecks
Errors
Errors
Where execution failed and why, with full stack traces
Installation
Check Prerequisites
Ensure you have:
- Python 3.9 or higher
- LangGraph installed (
pip install langgraph) - Arcbeam account and API key
Quick Start
1. Initialize Arcbeam
Add these lines at the start of your application:2. Run Your LangGraph Code
Your existing LangGraph code will automatically send traces:Configuration
Environment Variables
Use environment variables for credentials:Environment Tag
Add environment tag to organize traces:Advanced Usage
The Arcbeam connector automatically captures all LangGraph operations including graph executions, node transitions, state changes, LLM calls, and errors. All traces are tagged with your project ID and environment for easy filtering.Visualizing Agent Workflows
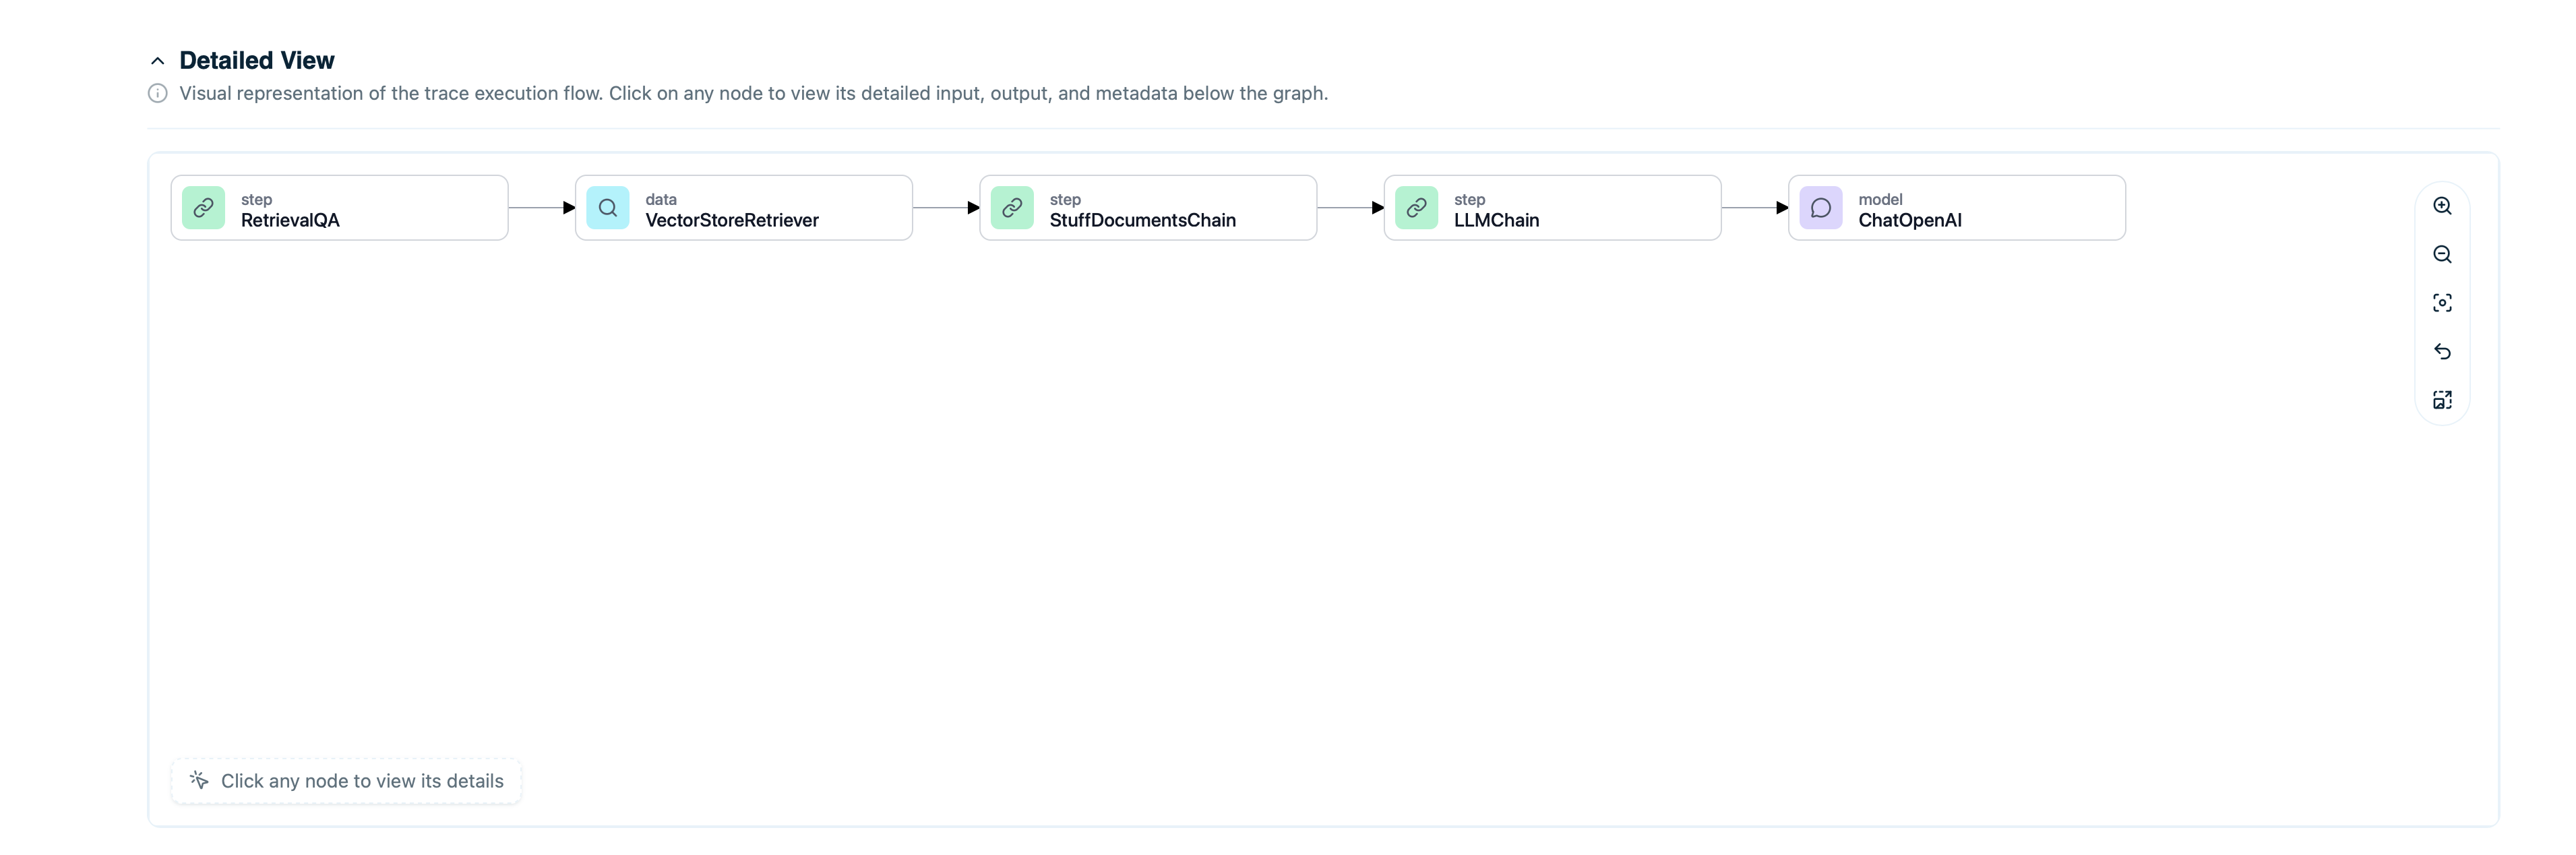
View Graph Execution
In the Arcbeam dashboard:- Go to Traces page
- Find your graph execution
- View the span tree showing:
- Graph execution span (top level)
- Node execution spans (children)
- LLM calls within nodes
- Tool calls within nodes
- Timing for each step
Understand Conditional Paths
See which edges were taken:- View decision points
- Check conditional logic outcomes
- Understand why certain nodes were skipped
- Identify unexpected routing
Example: Customer Service Agent
Full example with LangGraph and Arcbeam:Debugging LangGraph Applications
Find Failing Nodes
Filter traces with errors:- Set status filter:
error - View which node failed
- Check error message and stack trace
- Review node inputs that caused failure
Optimize Slow Paths
Identify performance bottlenecks:- Filter by duration:
> 10 seconds - View span tree to see slow nodes
- Check if specific LLM calls or retrievals are slow
- Optimize prompts or reduce retrieval count
Compare Different Paths
Understand routing decisions:- Create collection of similar queries
- Compare which paths they took
- See if conditional logic works as expected
- Identify edge cases
Track State Evolution
See how state changes through the graph:- View trace detail
- Check state at each node
- Verify state updates are correct
- Debug unexpected state changes
Connecting Data Sources
To enable data lineage for retrieval nodes:- Connect your vector store as a dataset in Arcbeam
- Map document ID columns
- Sync metadata
Best Practices
Initialize Before Graph Definition
Callconnector.init() before defining your graph:
Use Descriptive Node Names
Name nodes clearly:Troubleshooting
Traces Not Appearing
Check Initialization: Ensureconnector.init() is called before graph compilation.
Check Credentials: Verify API key and project ID:
Missing Node Details
The connector automatically captures node executions and transitions. Ensure your graph is properly defined with descriptive node names.Performance Impact
Traces are sent asynchronously and shouldn’t impact performance. If you experience issues, check your network connection to the Arcbeam platform.Next Steps
LangChain Integration
Instrument LangChain applications
Add Data Sources
Connect vector stores for data lineage
Find Problematic Traces
Debug LangGraph workflows
Understand Retrieval Quality
Optimize retrieval nodes